International College of Digital Innovation, CMU
June 23, 2026
Quotes
รู้เขารู้เรา รบร้อยครั้งชนะร้อยครั้ง
One who knows the enemy and knows himself will not be in danger in a hundred battles.
知彼知己,百战不殆。 (Zhī bǐ zhī jǐ, bǎi zhàn bù dài.)
သူတို့ကိုလည်း သိတတ်၊ ကိုယ့်ကိုလည်း သိတတ်လျှင် တိုက်ခိုက်သည့်တိုင်း မရှုံးနိုင်။
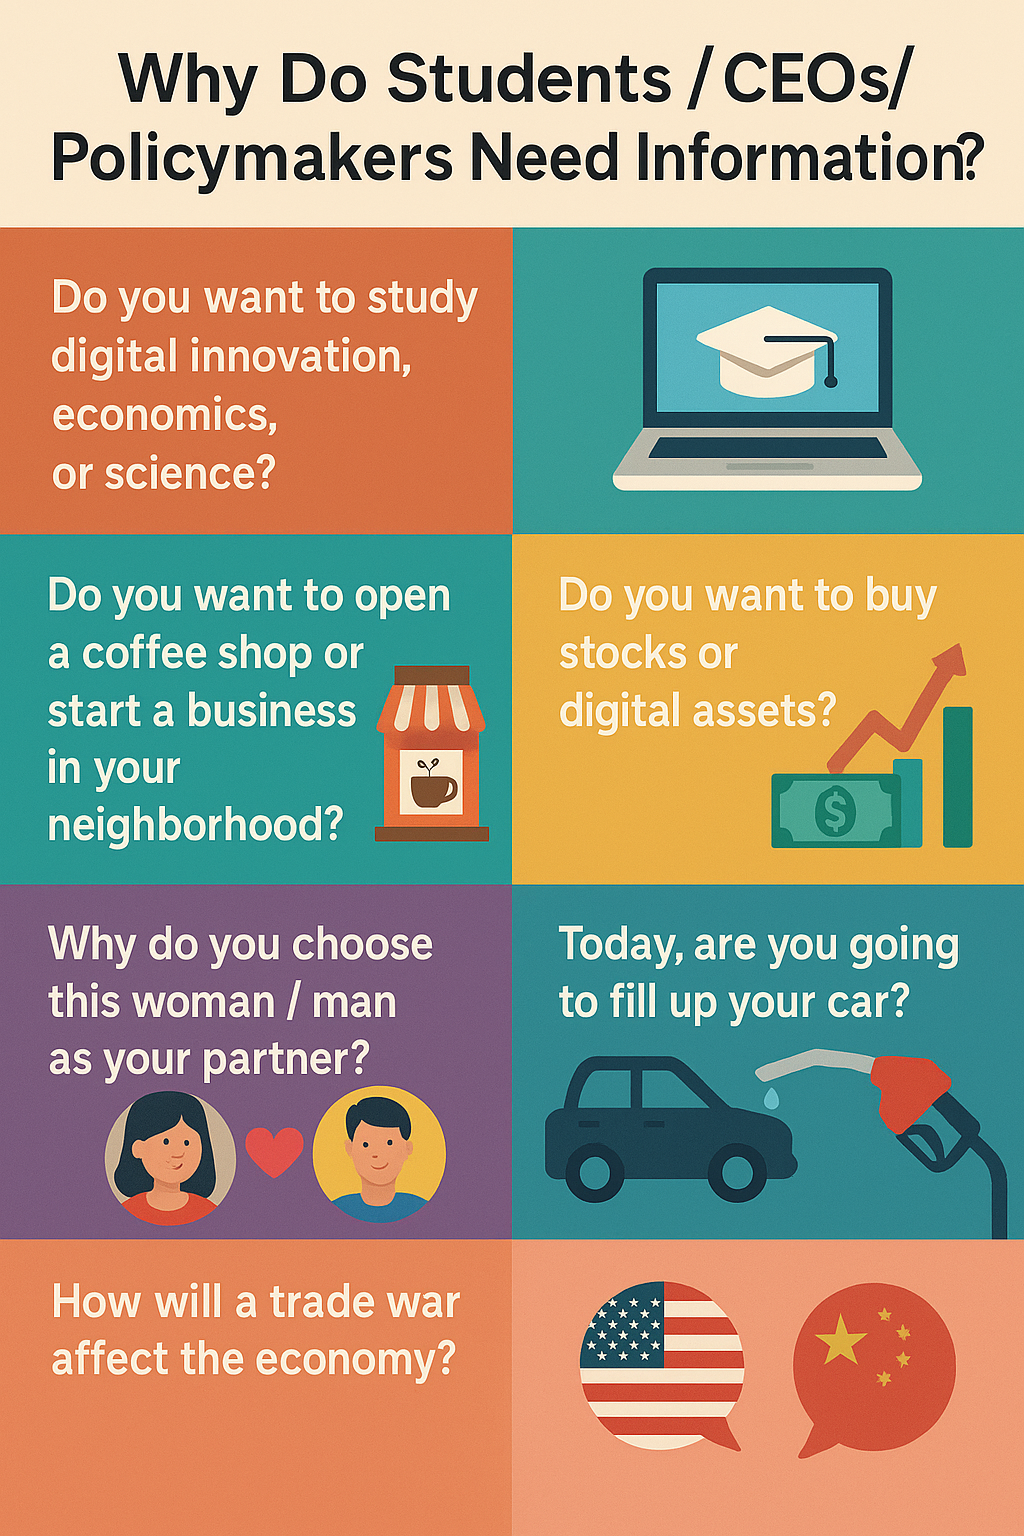
Do you want to study a program in digital innovation, economics, or science?
Are you planning to open a coffee shop or start a business in your neighborhood?
Are you interested in buying stocks or digital assets?
Why did you choose this woman/man to be your partner?
Will you fill up your gas tank today?
How will the trade war affect the economy?
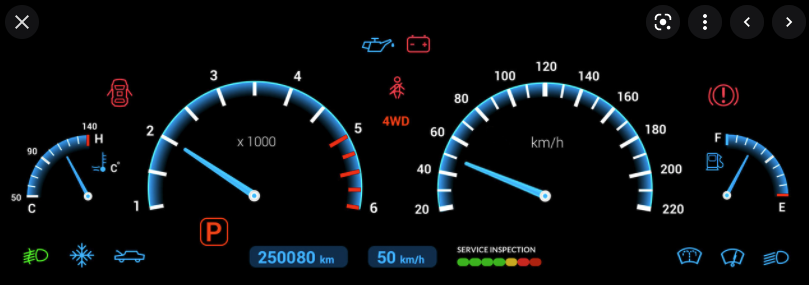
What insights can we gather from the car’s dashboard?
Based on the chart, should you buy or sell BTC?
Considering the number of nearby cafés, would you still open a coffee shop in this area?
Species
Y-Axis
for scatter plot
Graph Type
filtered = data.filter(d => species === "All" || d.Species === species)
// 4. วาดกราฟที่มีความสมบูรณ์เชิง Reactivity
Plot.plot({
height: 500,
grid: true,
color: { legend: true },
// ปรับชื่อป้ายแกน Y ให้เปลี่ยนผันตามชนิดของกราฟเพื่อความถูกต้อง
y: { label: chartType === "Scatter" ? "Petal.Length" : xVar },
x: { label: chartType === "Scatter" ? xVar : "Species" },
marks: [
chartType === "Scatter"
? Plot.dot(filtered, {
x: xVar,
y: "Petal.Length",
fill: "Species",
tip: true
})
// ปรับปรุง Box Plot ให้เปลี่ยนแกน Y ตาม xVar ที่เลือก และสลับแกนให้ถูกต้อง
: [
Plot.boxY(filtered, {
x: "Species",
y: xVar, // 👈 เปลี่ยนตรงนี้ให้รับค่าจากไอเทมสไลด์ด้านซ้ายมือ
fill: "Species",
inset: 10 // เพิ่มระยะห่างให้แท่งสวยงาม ไม่หนาเทอะทะเกินไป
})
]
]
})import { Plot } from "@observablehq/plot"
d3 = require("d3@7")
// 2. Sample data
bizData = [
{ id: 1, month: "Jan", revenue: 4500, users: 120, satisfaction: 85 },
{ id: 2, month: "Feb", revenue: 5200, users: 150, satisfaction: 88 },
{ id: 3, month: "Mar", revenue: 4800, users: 140, satisfaction: 82 },
{ id: 4, month: "Apr", revenue: 6100, users: 190, satisfaction: 91 },
{ id: 5, month: "May", revenue: 5900, users: 185, satisfaction: 89 },
{ id: 6, month: "Jun", revenue: 7200, users: 210, satisfaction: 94 }
]
// 3. Advanced CSS customization
html`
<style>
form[class*="inputs-"] {
display: flex !important;
flex-wrap: nowrap !important;
align-items: center !important;
justify-content: center !important;
gap: 35px !important;
width: 100% !important;
margin: 15px 0 !important;
color: white !important;
white-space: nowrap !important;
}
div[class*="inputs-"] label {
display: flex !important;
align-items: center !important;
gap: 6px !important;
color: #cbd5e1 !important;
font-size: 1em !important;
cursor: pointer !important;
}
input[type="radio"] {
accent-color: #a855f7 !important;
transform: scale(1.1);
}
.stats-grid {
display: grid;
grid-template-columns: repeat(3, 1fr);
gap: 15px;
margin-bottom: 20px;
}
</style>
<div class="stats-grid" style="font-family: 'Sarabun', sans-serif;">
<div style="background: rgba(30, 41, 59, 0.8); padding: 12px; border-radius: 12px; border-top: 4px solid #a855f7; text-align: center; color: white;">
<div style="font-size: 0.75em; color: #94a3b8;">Total Revenue</div>
<div style="font-size: 1.6em; font-weight: bold; color: #e9d5ff;">$${d3.sum(bizData, d => d.revenue).toLocaleString()}</div>
</div>
<div style="background: rgba(30, 41, 59, 0.8); padding: 12px; border-radius: 12px; border-top: 4px solid #eab308; text-align: center; color: white;">
<div style="font-size: 0.75em; color: #94a3b8;">Accumulated Users</div>
<div style="font-size: 1.6em; font-weight: bold; color: #fef08a;">${bizData[bizData.length-1].users} users</div>
</div>
<div style="background: rgba(30, 41, 59, 0.8); padding: 12px; border-radius: 12px; border-top: 4px solid #ec4899; text-align: center; color: white;">
<div style="font-size: 0.75em; color: #94a3b8;">Customer Satisfaction</div>
<div style="font-size: 1.6em; font-weight: bold; color: #fbcfe8;">${bizData[bizData.length-1].satisfaction}%</div>
</div>
</div>`viewof selectedMetric = Inputs.radio(
new Map([["💰 Revenue", "revenue"], ["👥 Users", "users"], ["😊 Satisfaction", "satisfaction"]]),
{value: "revenue"}
)
// 5. Draw chart
{
const colorMap = { revenue: "#a855f7", users: "#eab308", satisfaction: "#ec4899" };
const labelMap = { revenue: "Revenue ($)", users: "Users", satisfaction: "Satisfaction (%)" };
const chart = Plot.plot({
height: 340,
width: 850,
marginLeft: 70,
style: { background: "transparent", color: "#94a3b8", fontSize: "14px" },
x: { domain: bizData.map(d => d.month), label: "Month" },
y: { grid: true, label: labelMap[selectedMetric], labelOffset: 50 },
marks: [
Plot.lineY(bizData, { x: "month", y: selectedMetric, stroke: colorMap[selectedMetric], strokeWidth: 4, curve: "monotone-x" }),
Plot.areaY(bizData, { x: "month", y: selectedMetric, fill: colorMap[selectedMetric], fillOpacity: 0.12, curve: "monotone-x" }),
Plot.dot(bizData, { x: "month", y: selectedMetric, fill: colorMap[selectedMetric], r: 5, stroke: "#0f172a", strokeWidth: 2 }),
Plot.text(bizData, { x: "month", y: selectedMetric, text: d => d[selectedMetric], dy: -18, fill: "white", fontWeight: "600" })
]
});
return html`<div style="display: flex; justify-content: center; width: 100%;">${chart}</div>`;
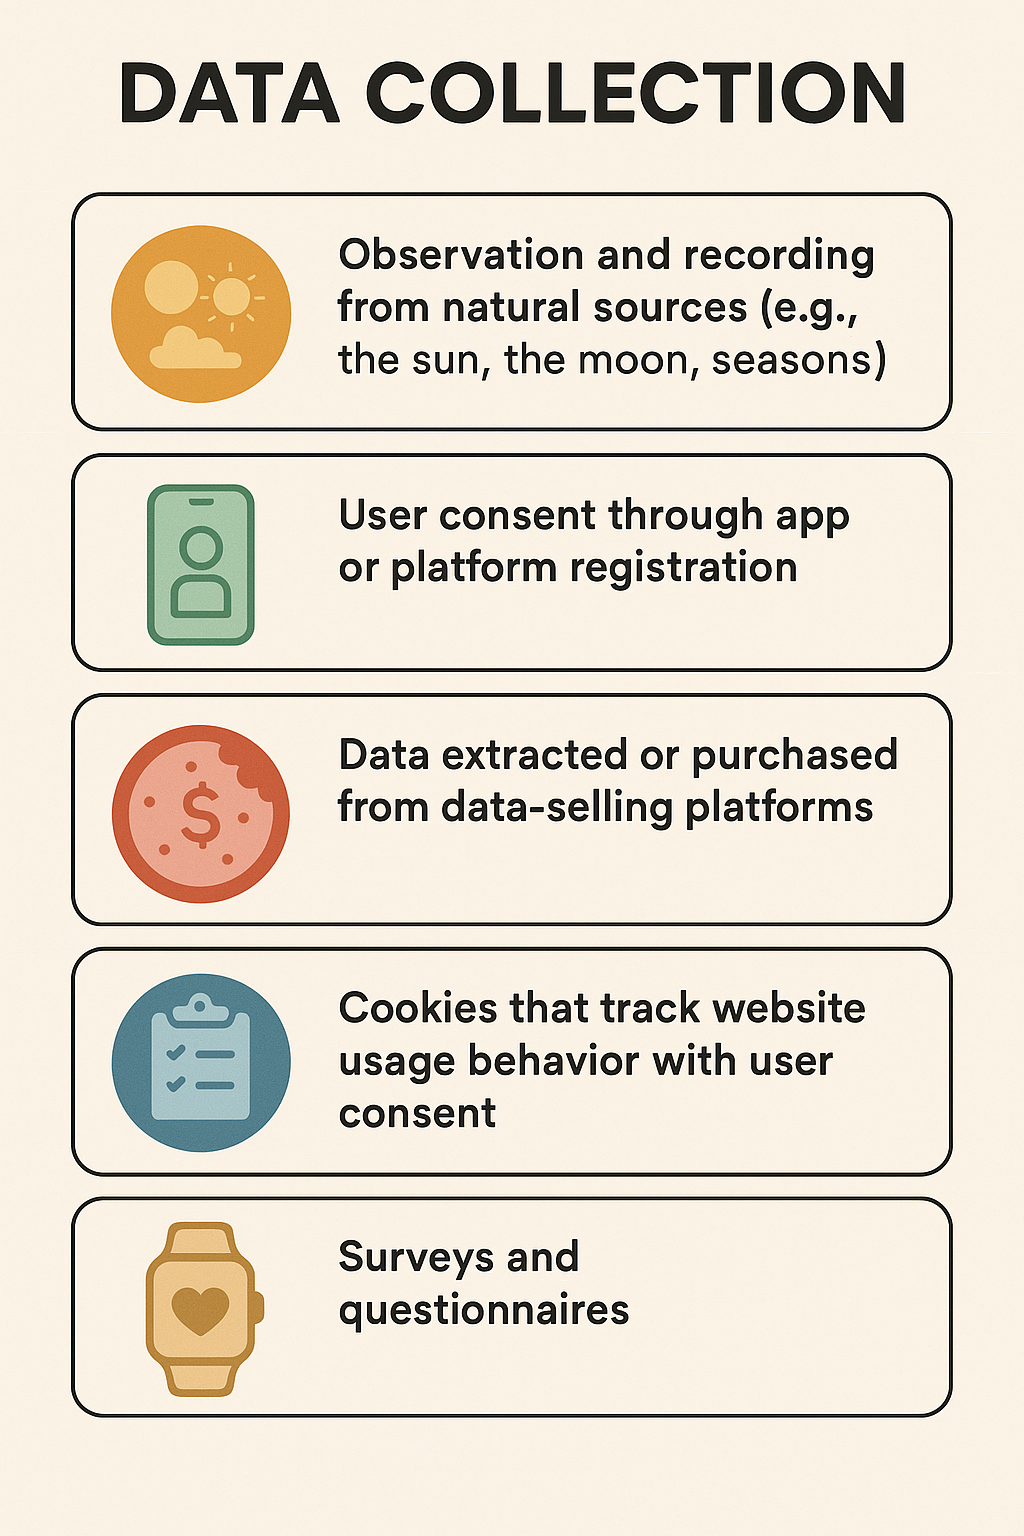
}Observation and recording from natural sources (e.g., the sun, the moon, seasons)
User consent through app or platform registration
Data extracted or purchased from data-selling platforms
Cookies that track website usage behavior with user consent
Surveys and questionnaires
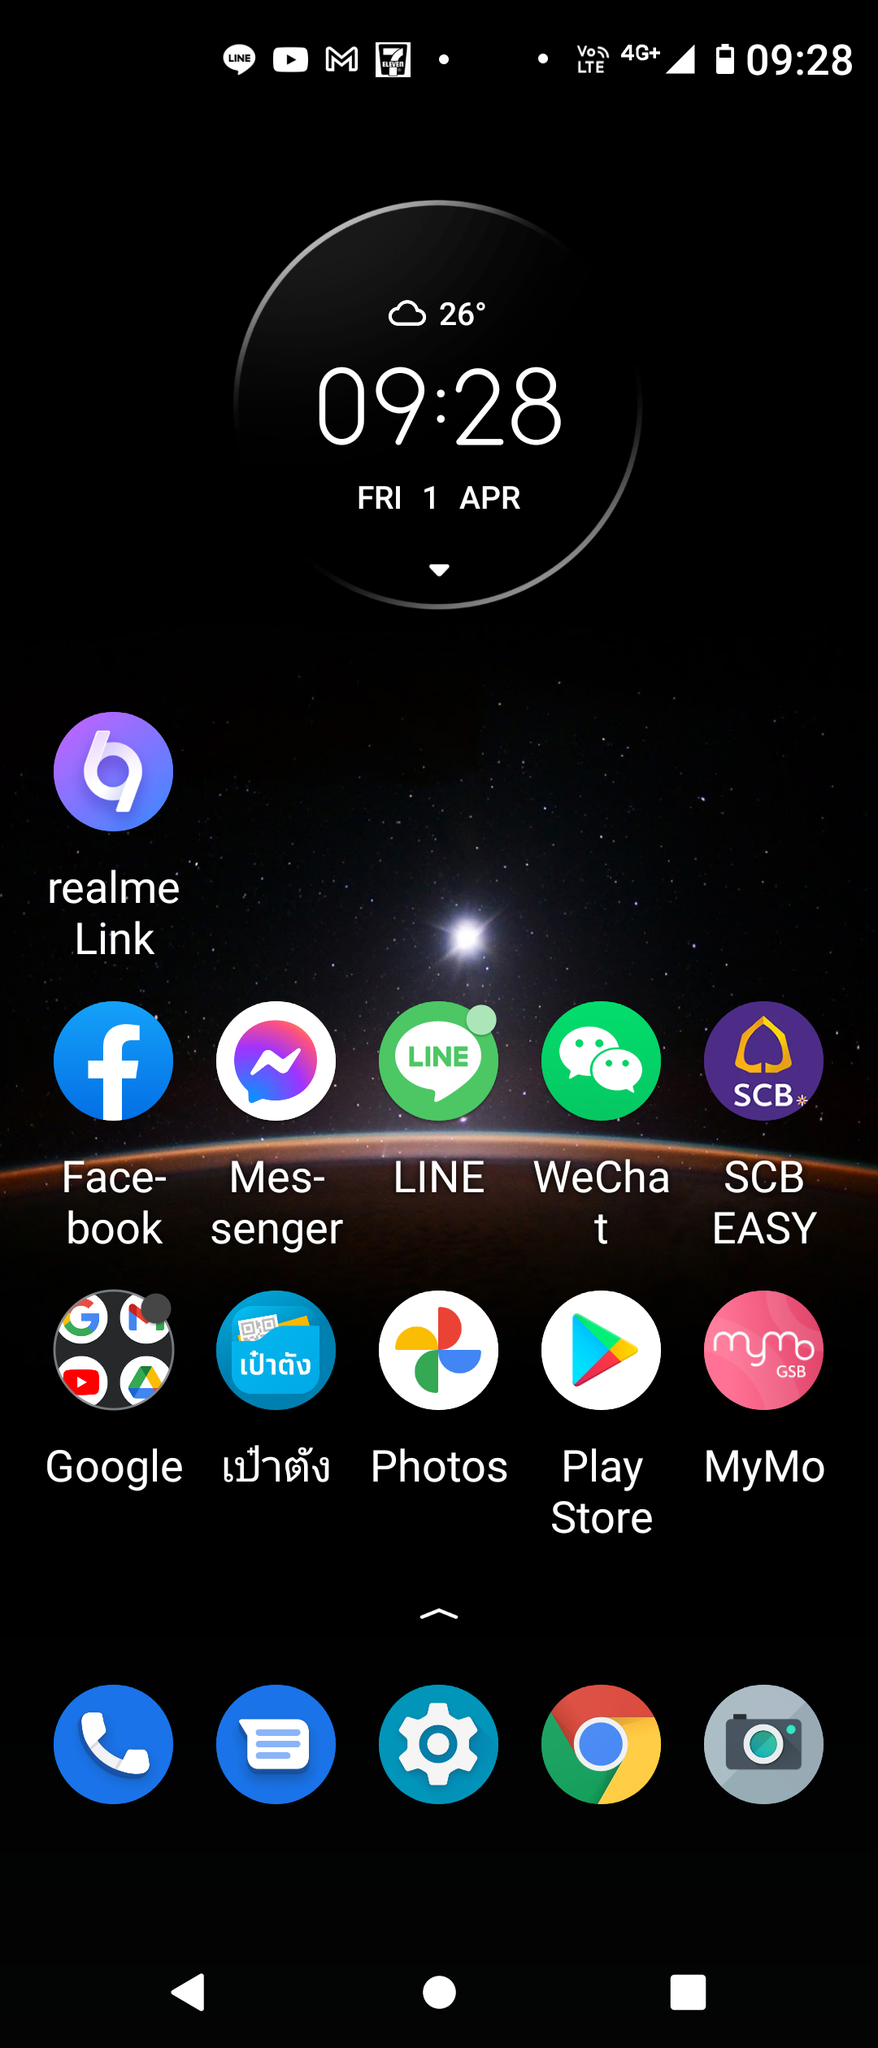
Sensor or IoT data (e.g., smartwatches worn by students)
Transaction and exchange data
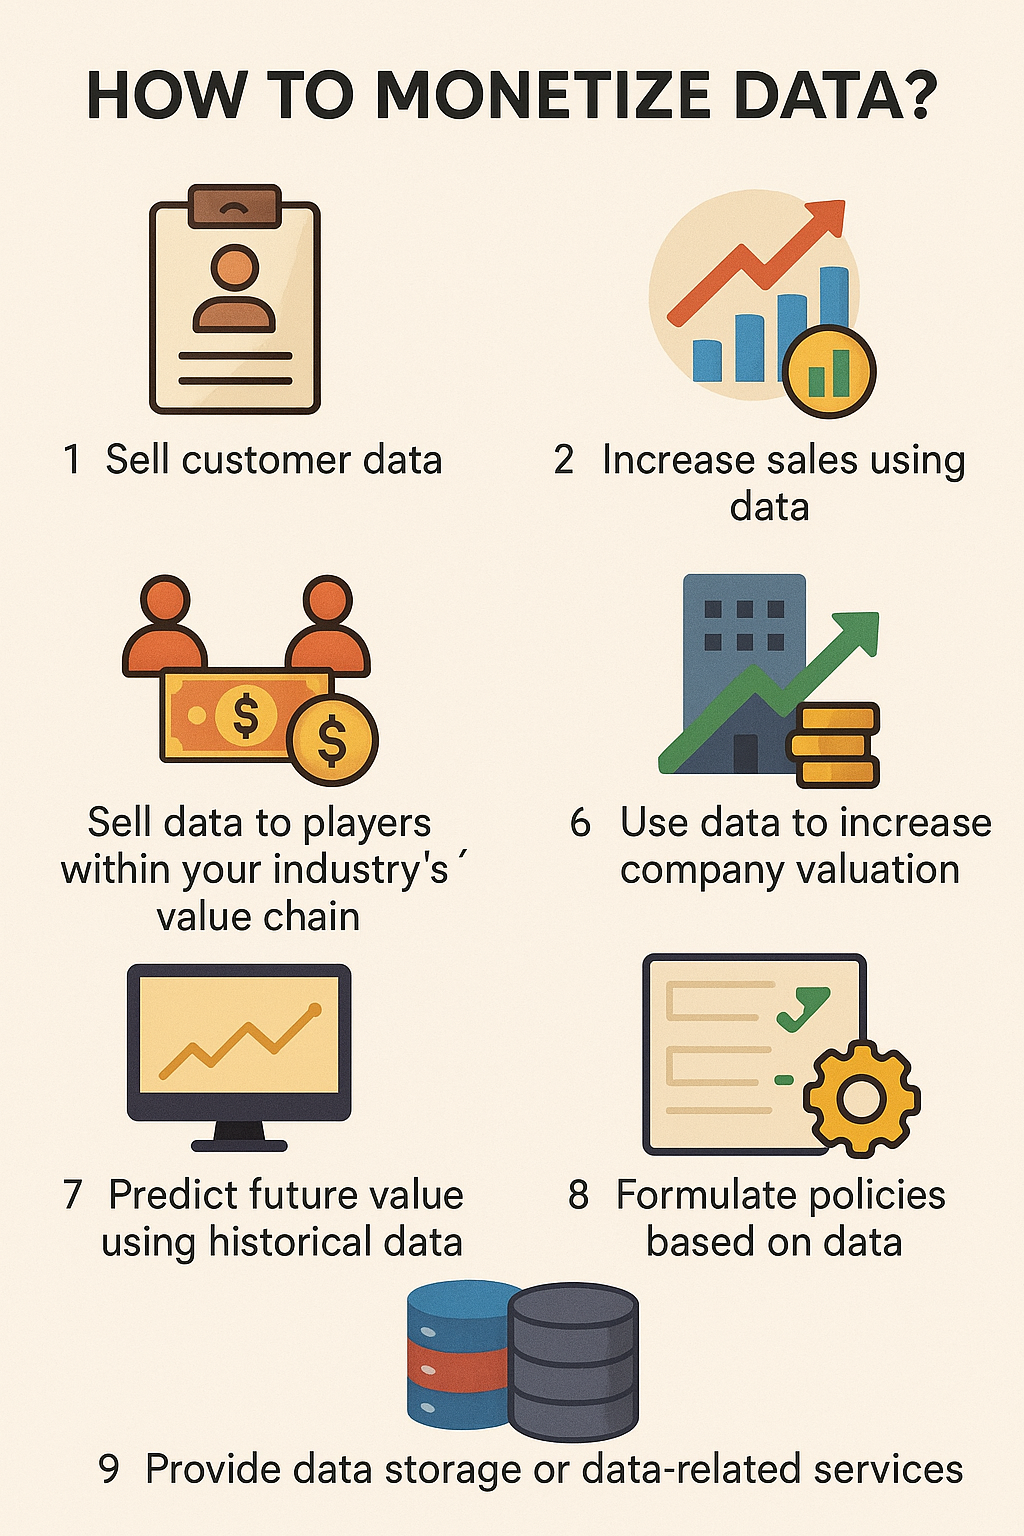
Sell customer data
Increase sales using data
Use data for marketing and advertising
Sell data to players within your industry’s value chain
Sell data to players outside your own industry
Use data to increase company valuation
Predict future value using historical data
Formulate policies based on data
Provide data storage or data-related services
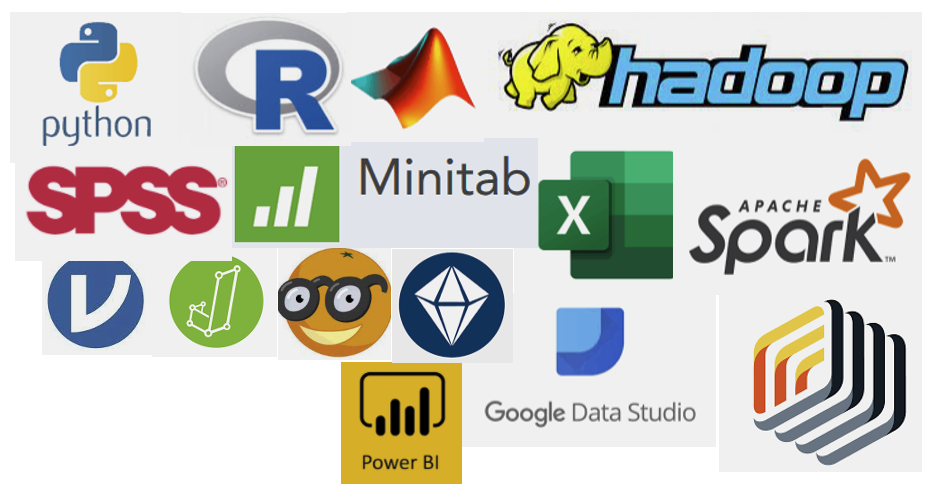
R Code
Python Code