Internation College of Digital Innovation, CMU
June 30, 2026
“Customer named John Doe, 32 years old, purchased goods worth $120. Contactable at: john.d@example.com”
“Jane Smith, 28 years old, and has purchased goods worth $250. Her email is jane.s@example.com”
“Bob Lee, 45 years old, spent $90. He can be contacted at bob.lee@example.com”
🟠 Problems with Raw Text Data:
Difficult to extract the required values (e.g., age, purchase amount).
Cannot be analyzed or summarized without data transformation.
Not ready for use in Excel, R, or any databases.
What data do you need?
Identify the required fields (e.g., Name, Age, Email, Purchase Amount)
Some parts of the text may be unnecessary and can be ignored during the data transformation process.
Is the data format consistent?
Check if all entries follow a similar pattern.
If sentence structures vary, custom extraction methods like regular expressions (regex) may be required.
Are there missing or ambiguous values?
Some entries might lack certain fields (e.g., missing email or age information).
Plan how to handle missing data or incomplete information.
Is data cleaning or standardization required?
Example: Remove currency symbols like “$”, standardize names (e.g., “Mr. John Doe” → “John Doe”)
Convert all data segments into a usable format (e.g., numbers for purchase amount, integers for age)
✨ Example
Raw text:
“Customer John Doe, aged 32, bought products worth $120. Contact: john.d@example.com”
Should be transformed into:
| Name | Age | Purchase | |
|---|---|---|---|
| John Doe | 32 | 120 | john.d@example.com |
“Customer John Doe, aged 32, bought products worth $120. Contact: john.d@example.com”
“Jane Smith is 28 years old and made a purchase of $250. Her email is jane.s@example.com”
“Bob Lee, 45 years old, spent $90. You can reach him at bob.lee@example.com”
| StudentID,StudentName,CourseCode,ProjectTitle,ProjectType,PrimaryAdvisor,CoAdvisor,RegistrationDate |
|---|
| 652110001,John Doe,888399,Smart IoT Agriculture Monitoring System,Agriculture and Biotechnology Industry,Dr. Somsak Jannaem,,2026-06-15 |
| 652110002,Alice Smith,888498,AI-Powered Tourism Recommendation App,Smart Tourism,Dr. Wilawan Srichaikul,Dr. Somsak Jannaem,2026-06-16 |
| 652110003,Li Wei,888499,Predictive Maintenance for Smart Factories,Manufacturing,Dr. Somsak Jannaem,,2026-06-17 |
| 652110004,Somchai Jaidee,888399,Blockchain-Based Food Traceability Platform,Food and Future Industry,Dr. Wilawan Srichaikul,,2026-06-18 |
| 652110005,Sarah Connor,888499,Autonomous Drone for Crop Health Analysis,Agriculture and Biotechnology Industry,Dr. Somsak Jannaem,Dr. Wilawan Srichaikul,2026-06-19 |
| 652110006,Chen Gonzalo,888498,E-Commerce Chatbot Using Large Language Models,Digital Technology,Dr. Wilawan Srichaikul,,2026-06-20 |
| 652110007,Emily Watson,888399,Smart EV Charging Station Network Optimizer,Smart Electronic Technology,Dr. Somsak Jannaem,,2026-06-21 |
| LogID | Timestamp | IndustrySector | CompanyName | ProjectScope | AllocatedBudget |
|---|
| L001 | 2026-06-29 09:00:00 | Digital Technology | CyberNet Solutions | Cloud Migration & Security | 450000 |
| L002 | 2026-06-29 10:15:30 | Smart Electronic Technology | MicroChip Lab | Edge AI Hardware Prototype | 750000 |
| L003 | 2026-06-29 11:45:12 | Manufacturing | AutoMech Industries | Robotic Arm Automation Pipeline | 1200000 |
| L004 | 2026-06-29 13:20:00 | Food and Future Industry | BioNutrient Foods | Plant-Based Protein Scale-Up | 320000 |
| L005 | 2026-06-29 14:05:45 | Agriculture and Biotechnology Industry | GreenAgro Tech | Automated Hydroponics System | 180000 |
| L006 | 2026-06-29 15:30:22 | Smart Tourism | Destination CMU | VR Historical Site Guidebook Platform | 250000 |
There are messages without any pattern that Excel cannot handle.
A 28-year-old female researcher named Sarah Jenkins, holding a Master’s degree and making $55,000 annually, can be reached at s.jenkins@academic.edu.
Please contact Alex Rivera (alex.rivera@techcorp.io); he is a senior software engineer with a Bachelor of Science who earns around 95,000 USD at age 34.
Holding a PhD in Economics, Dr. Chloe Tan is a 45-year-old woman working as a university professor with a yearly income of $120,000 (chloe.tan@university.edu).
Our new intern, Michael Chang, is a 22-year-old male undergraduate student who currently makes $15,000 part-time, reachable via m.chang@student.net.
Emily Watson (emily.w@designstudio.com) is currently employed as a creative director; she’s 41, holding a BFA degree, and her salary is 85,000 dollars.
With a high school diploma, 19-year-old David Miller earns $22,000 a year as a barista—email him at david.m97@coffeechat.com (Gender: Male).
Meet Jessica Taylor, a 52-year-old female consultant with an MBA making $140k; her primary contact email is jessica.t@consulting.biz.
Ryan Reynolds (ryan.r@freelance.org), a self-employed graphic designer aged 31, has an Associate Degree and brings in roughly $48,000.
A woman named Sofia Martinez who has a PhD works as a data scientist earning $110,000; she is 38 and her inbox is sofia.m@analytics.com.
At age 26, Kevin Jones (kevin.jones@startup.co) works as a marketing specialist with a Bachelor’s degree, pulling in a salary of $50,000.
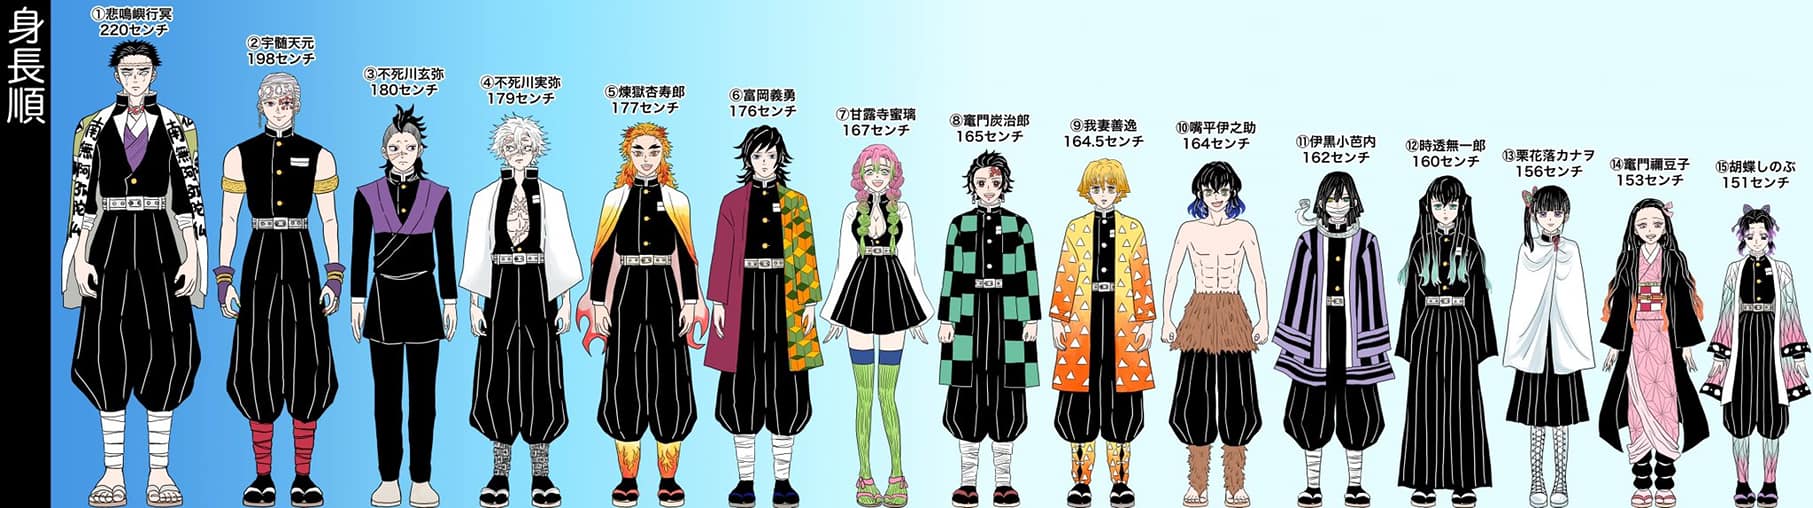
Analyze the image and construct a structured table to categorize the characters according to their identifiable characteristics. Which fields (columns) will you define, and what is your approach for extracting the relevant information for each character?
| Character Name | Movie/Series | Character Type | Gender | Species | Costume Color | Is Human (Yes/No) |
|---|---|---|---|---|---|---|
| _ | _ | _ | _ | _ | _ | _ |
“Character Type” could be Hero, Villain, Sidekick, etc.
“Species” could be Human, Car, Animal, Monster, etc.
“Movie/Series” helps connect characters to their respective contexts (e.g., Toy Story, Cars, The Incredibles).
What challenges did you encounter when assigning values to each column?
Were there any characters whose attributes were ambiguous or unclear to interpret?
If you had to prepare this dataset for clustering or classification tasks, how would you prepare it?
| Character Name | Movie/Series | Character Type | Gender | Species | Costume Color | Is Human |
|---|---|---|---|---|---|---|
| Lightning McQueen | Cars | Hero | Male | Car | Red | No |
| Mater | Cars | Sidekick | Male | Car | Brown | No |
| Buzz Lightyear | Toy Story | Hero | Male | Toy | White/Green | No |
| Woody | Toy Story | Hero | Male | Toy | Yellow/Brown | No |
| Mr. Incredible | The Incredibles | Hero | Male | Human | Red/Black | Yes |
| Elastigirl | The Incredibles | Hero | Female | Human | Red/Black | Yes |
| Mike Wazowski | Monsters, Inc. | Sidekick | Male | Monster | Green | No |
| Sulley | Monsters, Inc. | Hero | Male | Monster | Blue/Purple | No |
| Jessie | Toy Story | Hero | Female | Toy | Red/White | No |
| Jack Sparrow | Pirates of the Caribbean | Hero | Male | Human | Brown/Black | Yes |
Learning Programming for Financial Data Analysis
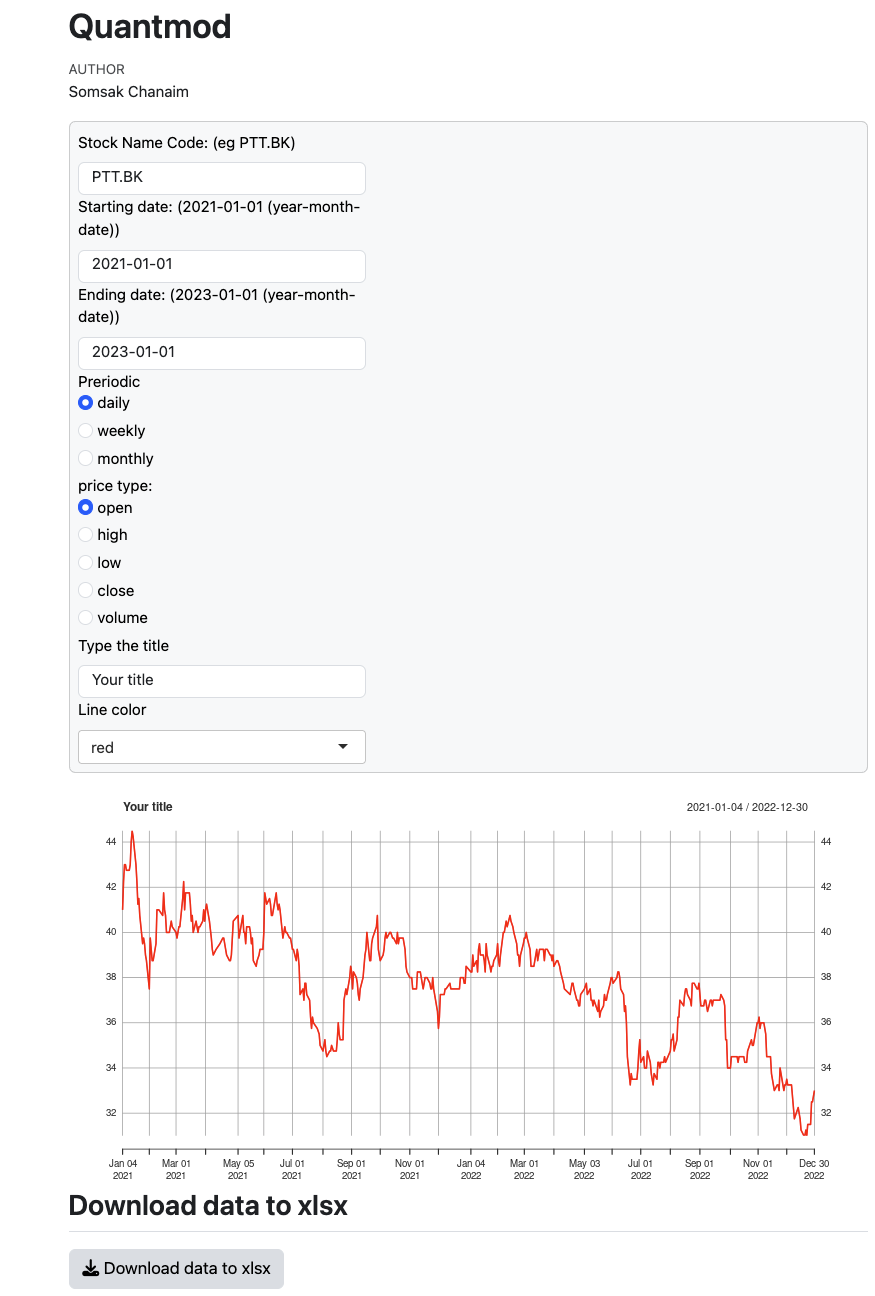
You can download financial data from Yahoo Finance using the quantmod package in R or the yfinance library in Python. Both tools are powerful and easy to use for time-series analysis and financial modeling.
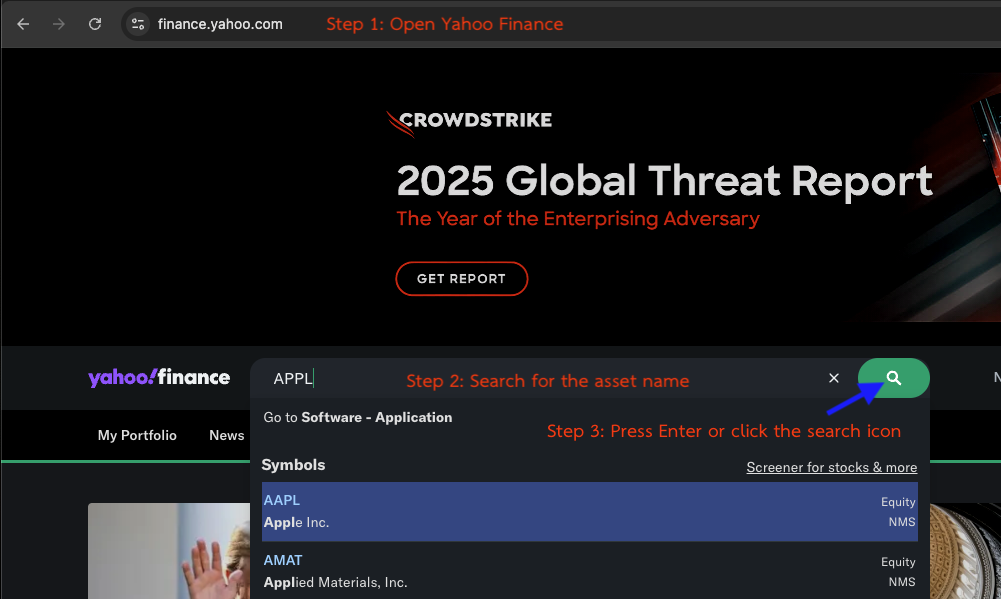
I am using Google Chrome (Mac).
นี่คือคำแปลภาษาอังกฤษ โดยยังคงโครงสร้างและรูปแบบ Markdown (รวมถึงลิงก์และข้อความตัวหนา) ไว้ทั้งหมดครับ:
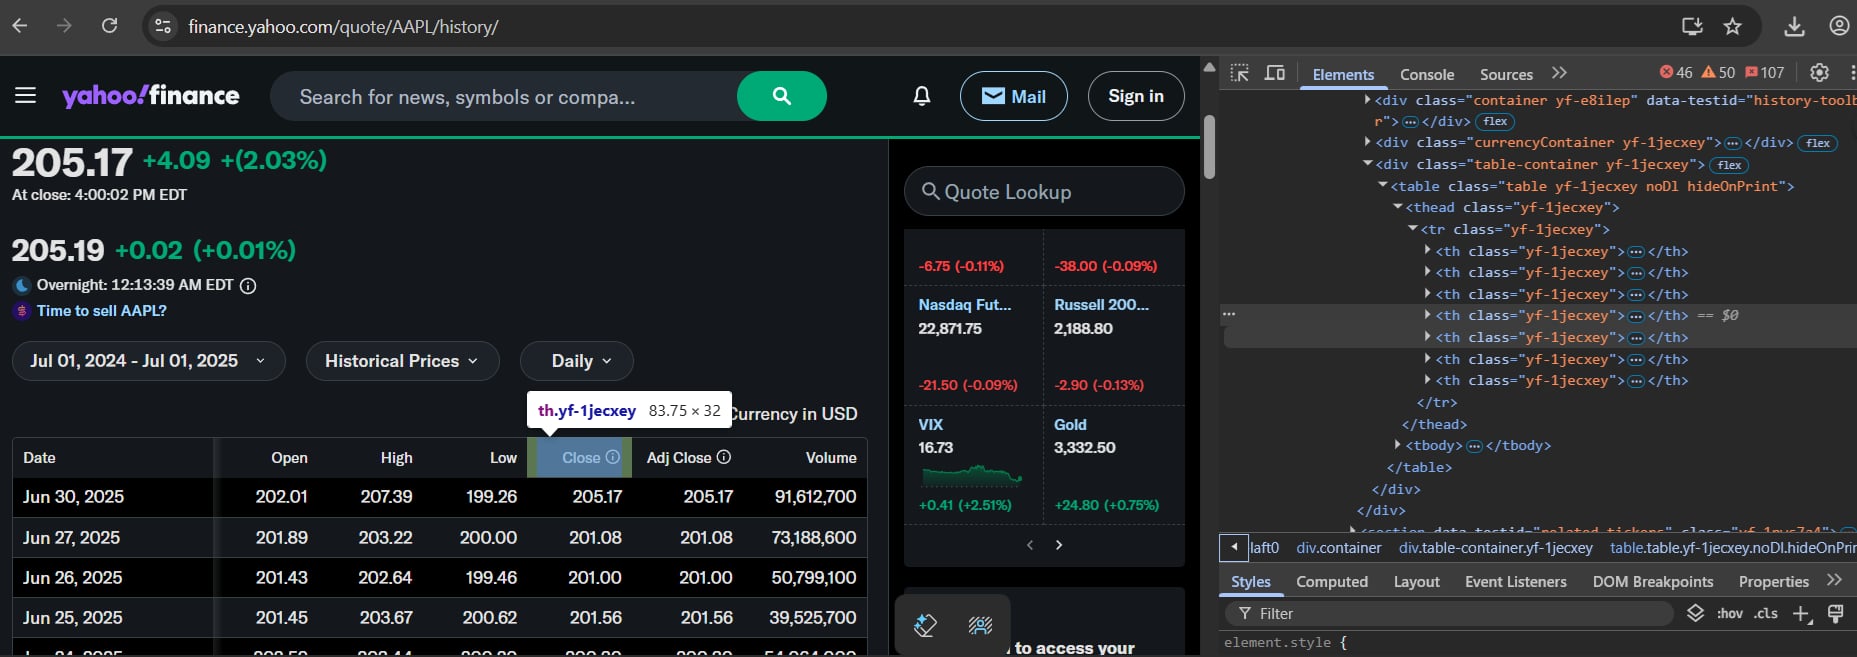
Step 1: Go to https://finance.yahoo.com/
Step 2: Search for the asset name
Step 3: Press Enter or click to search
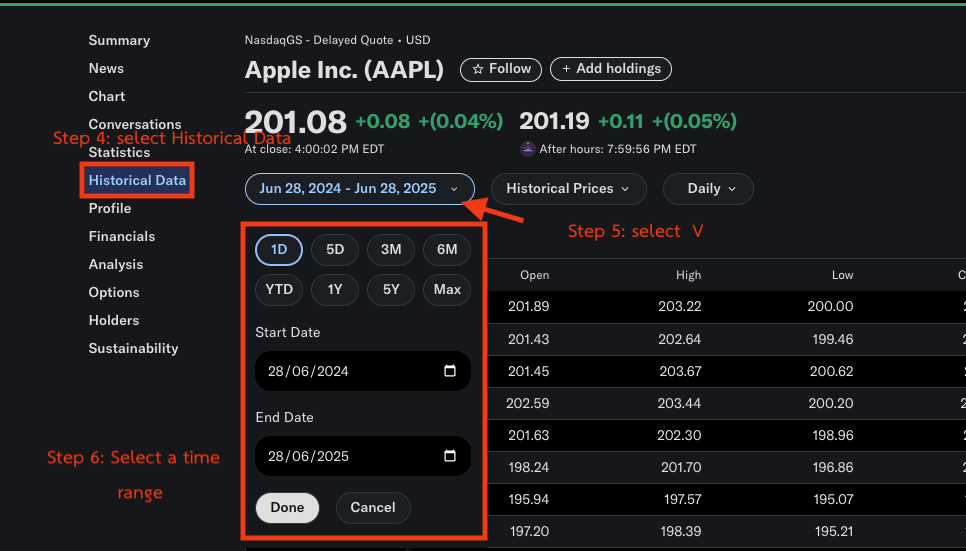
Step 4: Select Historical Data
Step 5: Select the \(\vee\) symbol
Step 6: Select the time range
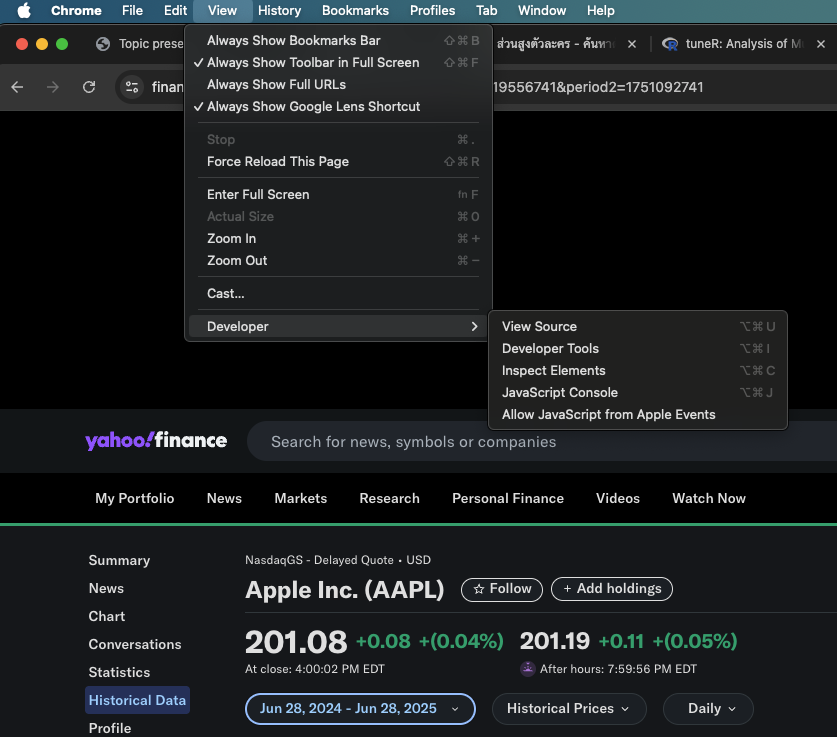
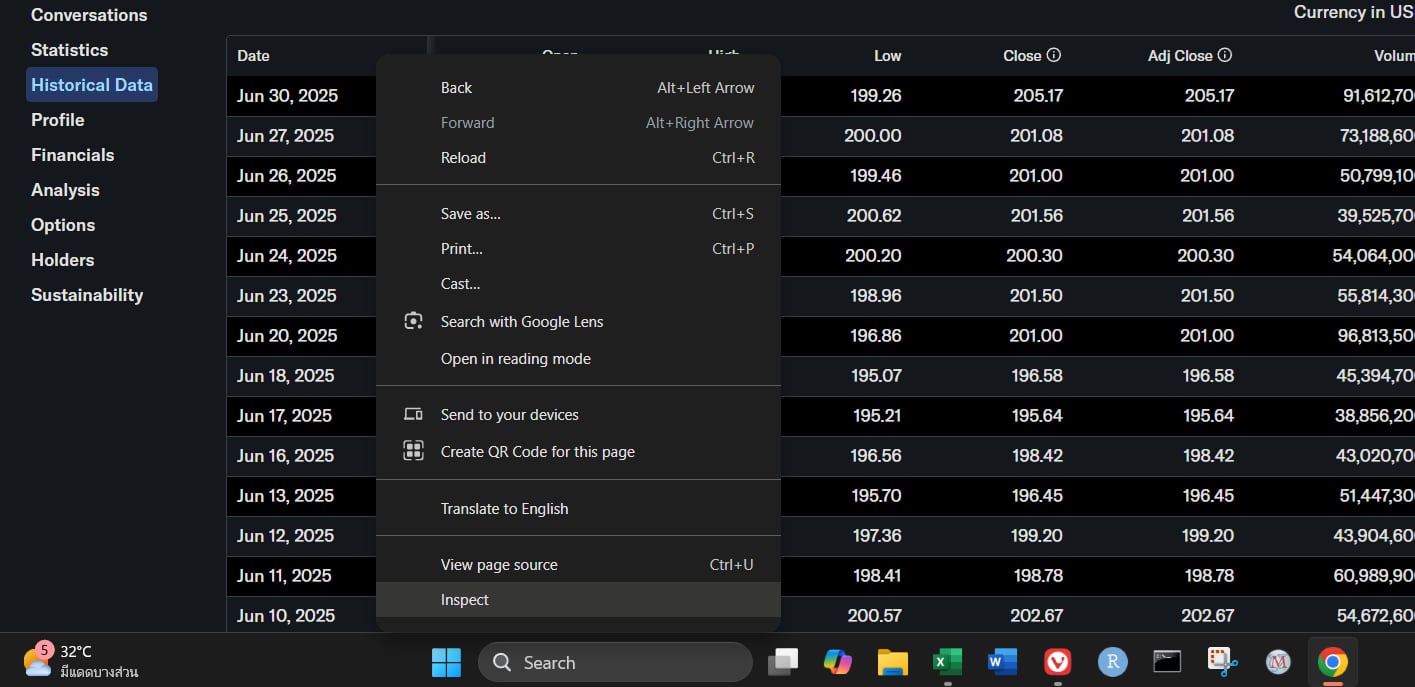
Step 7: menu View \(\rightarrow\) Developer \(\rightarrow\) Inspect Elements
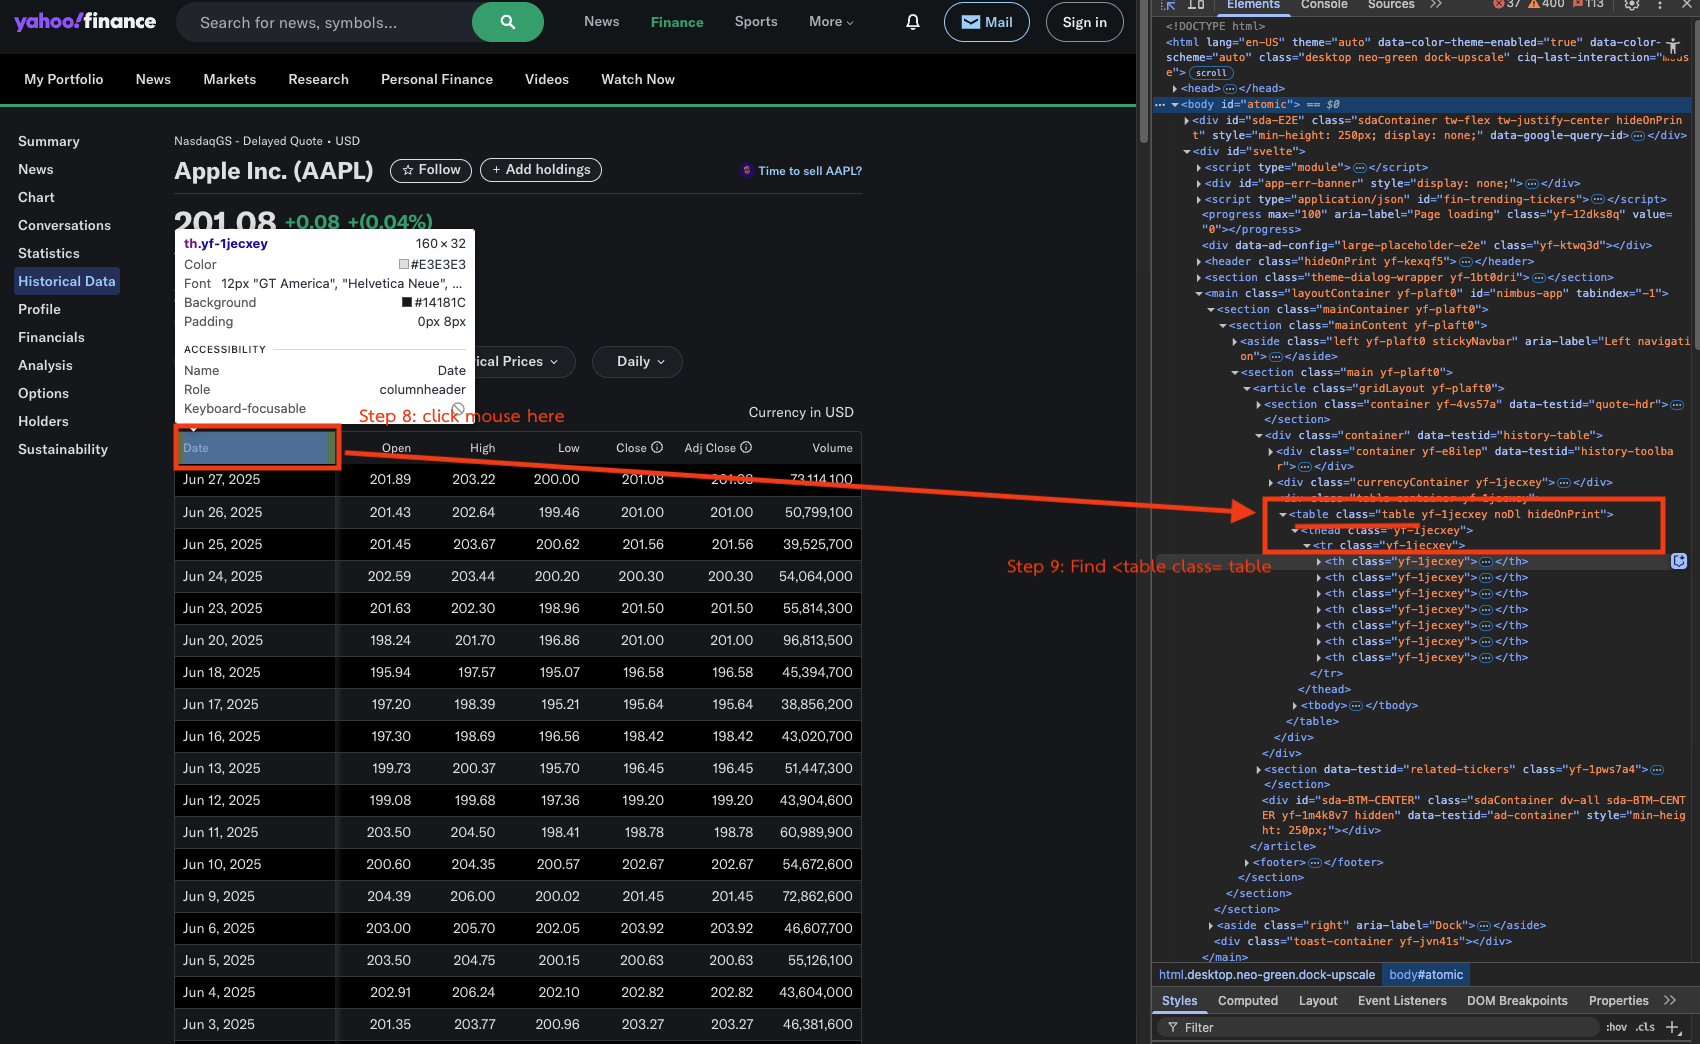
Step 8: Click on the Date column
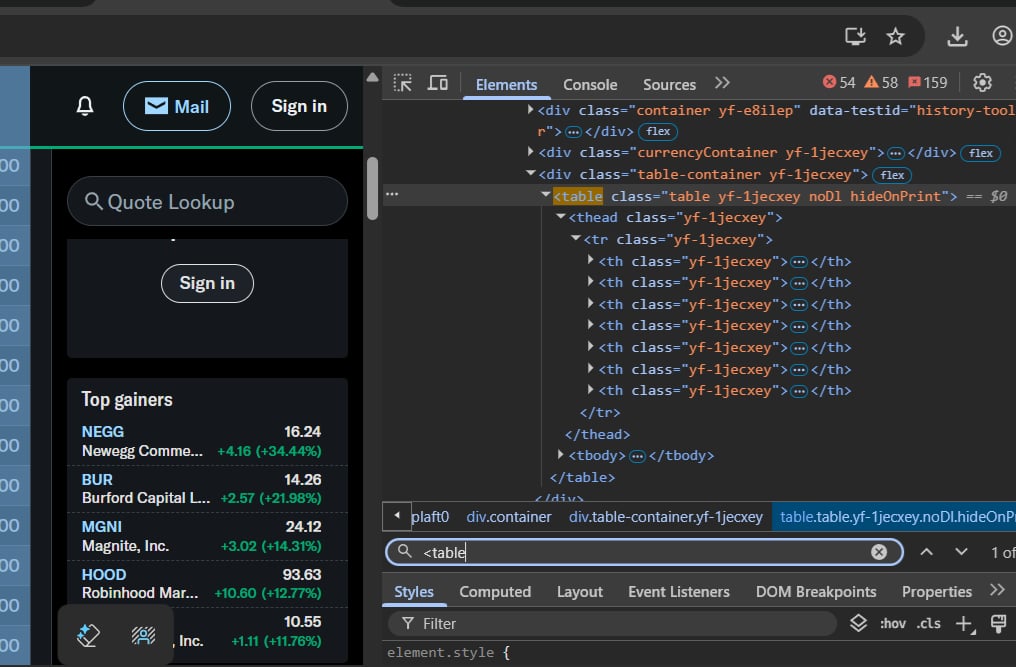
Step 9: On the right side, look for the line containing <table class="table"
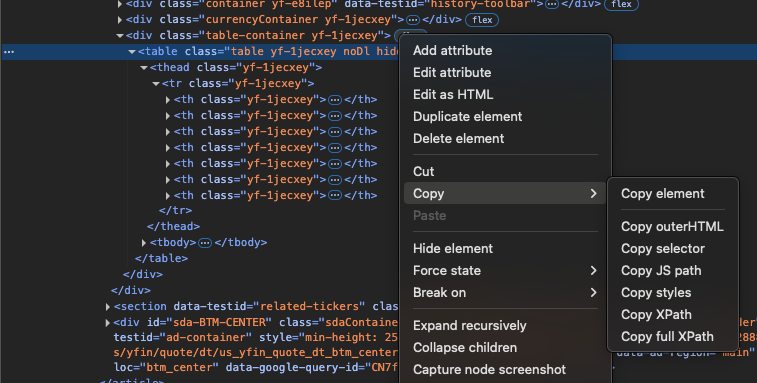
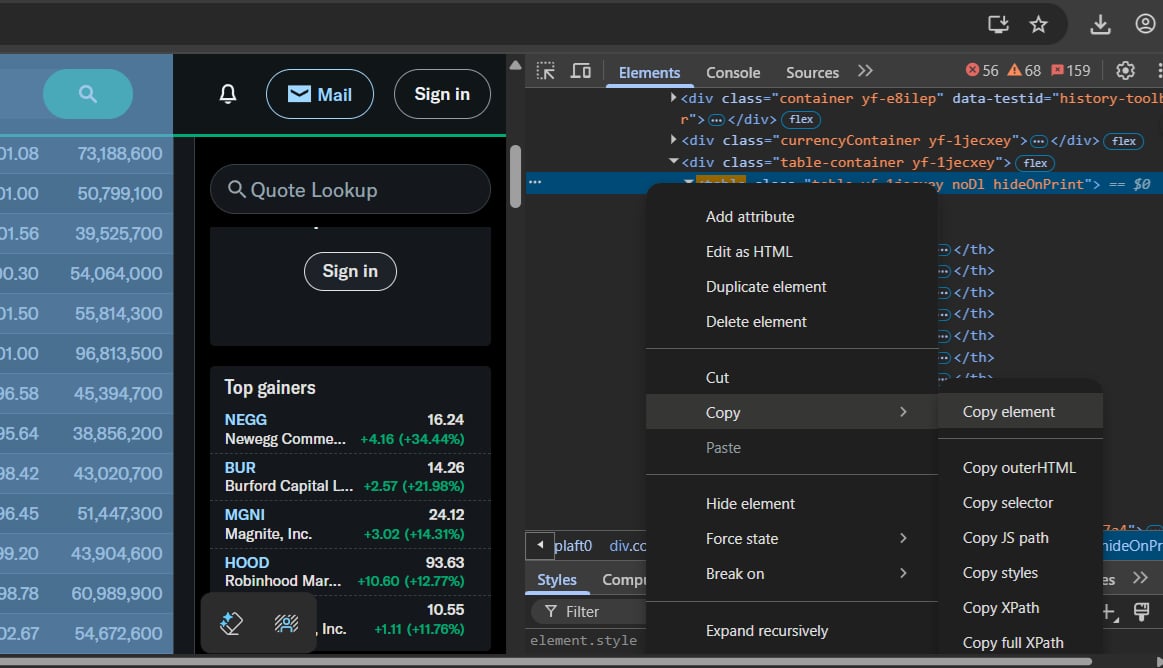
Step 10: Left-click \(\rightarrow\) Copy \(\rightarrow\) Copy element
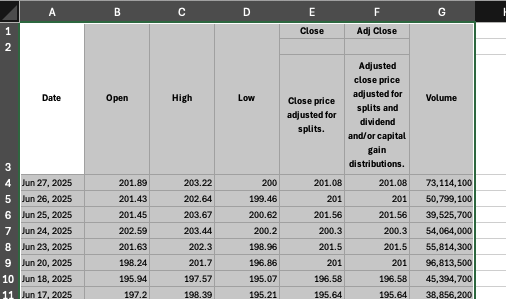
Step 11: Open Excel \(\rightarrow\) Press Ctrl+V
Please wait for further announcements
Transaction Data vs Structural Data
| Type | Description | Example Format |
|---|---|---|
| Transaction Data | Raw data recorded based on events or transactions. | Each row = 1 transaction |
| Structural Data | Data transformed into a structured format for analysis. | Row = Entity/Data unit, Column = Variable |
Suppose we have the following raw transaction data (e.g., from a grocery store):
| CustomerID | Product | Quantity | Date |
|---|---|---|---|
| C001 | Apple | 2 | 2025-06-01 |
| C001 | Banana | 1 | 2025-06-01 |
| C002 | Apple | 3 | 2025-06-02 |
| C002 | Orange | 2 | 2025-06-02 |
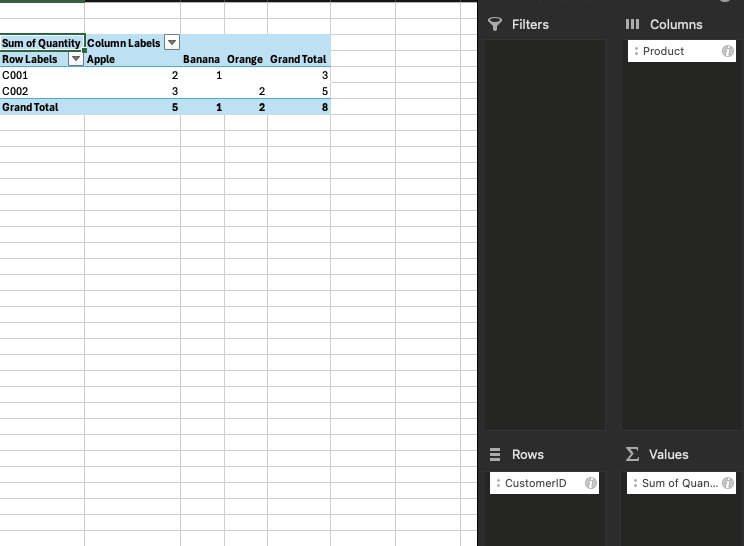
| CustomerID | Apple | Banana | Orange |
|---|---|---|---|
| C001 | 2 | 1 | 0 |
| C002 | 3 | 0 | 2 |
This format is sometimes called a pivot table, cross-tab, or wide format.
Available Tools
pivot_wider() from the tidyr package.pivot_table() or .groupby() + .unstack() Transaction data can be copied into Excel and summarized using a PivotTable.
Network data (or graph data) is data that shows relationships
(edges) between different entities (nodes). Examples of applications include:
🧾 Example of Network Data (Edge List)
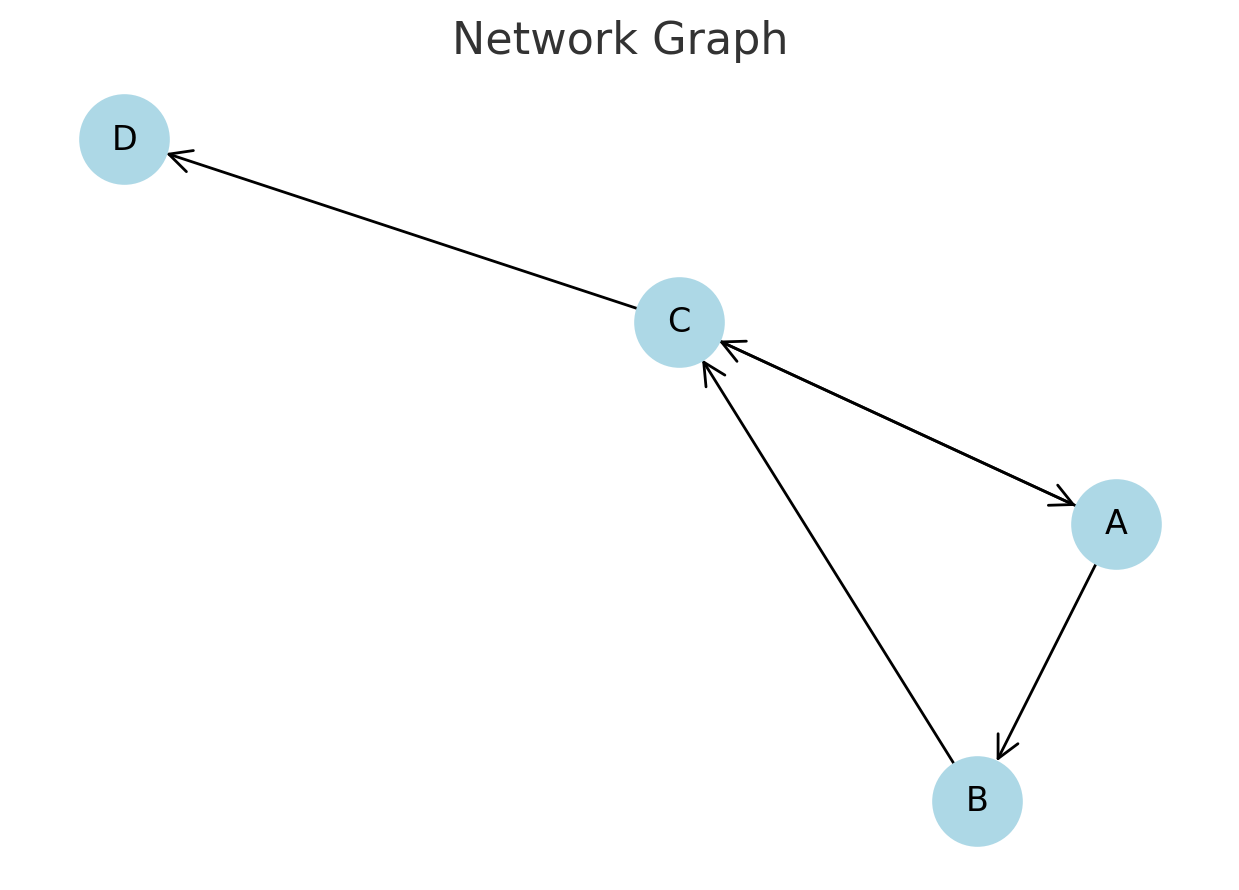
Structural Data (Adjacency Matrix)
🔐 Class Verification Password : ICDI2026