International College of Digital Innovation, CMU
June 20, 2026
You can download the dataset from googledrive
The dataset must be in a clean and complete tabular format:
Include headers in the first row, and each header must be unique.
Avoid empty rows or columns.
Do not use merged cells.
Ensure data consistency and clarity:
Columns with numeric values should only contain numbers.
Dates and text should be in an appropriate and consistent format.
Select the dataset, then go to Insert → Table (or press Ctrl + T).
Benefits of converting data into a table:
The table automatically expands when new data is added.
It helps prevent errors when selecting data ranges for the PivotTable.
Steps to Create a PivotTable
Select the data range you want to analyze.
Go to Insert → PivotTable.
Configure the Create PivotTable window:
Table/Range: Specify the data range (Excel will auto-select it if you clicked within the table).
Choose where to place the PivotTable:
Select New Worksheet: Recommended for large datasets.
Or choose Existing Worksheet: Specify a location in the current sheet.
Click OK.
After creating a PivotTable, you’ll see the following key components:
PivotTable Layout (on the worksheet):
The area where the summarized results are displayed.
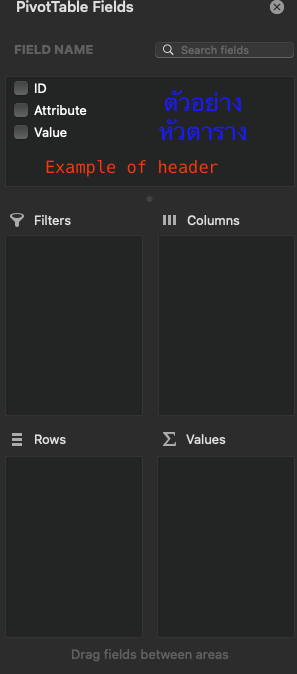
PivotTable Fields Pane (on the right):
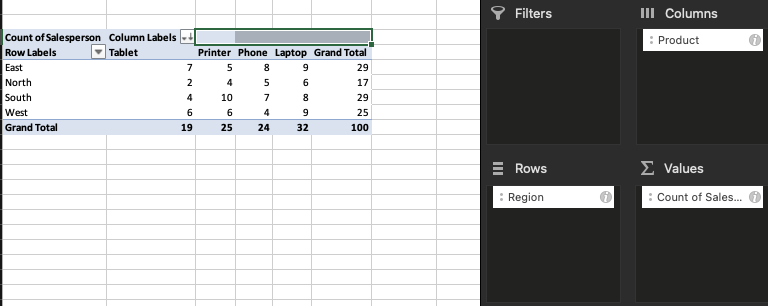
Use this pane to drag fields into specific areas:
Filters: Use to filter data, e.g., by year or product category.
Columns: Fields displayed as columns, e.g., Year, Quarter.
Rows: Fields displayed as rows, e.g., Product Name, Category.
Values: Numerical fields to be calculated, e.g., Sales, Quantity.
4.1 Adjusting Fields in the Values Area
By default, the Values area usually uses Sum:
If the data is numeric, it calculates the sum.
If the data is text, it counts the number of entries (Count).
To change the calculation function:
Click on the field in the [Values]]{.blue} area → choose Value Field Settings.
Select the desired function, such as:
Average: Calculates the average.
Max/Min: Returns the maximum or minimum value.
Count: Counts the number of rows.
4.2 Filtering Data with Filters
Drag the desired field into the Filters area.
A dropdown menu will appear in the PivotTable, allowing you to select which values to display.
4.3 Sorting Data
Right-click on a row or column → select Sort:
Sort Ascending: Sorts from smallest to largest.
Sort Descending: Sorts from largest to smallest.
5.1 Changing the PivotTable Style
Go to the Design tab:
Choose a suitable style from PivotTable Styles.
Turn Banded Rows or Banded Columns on/off to add alternating shading.
5.2 Show or Hide Subtotals & Grand Totals
In the Design tab:
Click Subtotals to show or hide subtotal rows.
Click Grand Totals to enable or disable total values for rows and columns.
| :::{.callout-note icon=false} ## 5.3 Displaying Data as Percentages |
| - Right-click on a field in the Values area → select Show Values As: |
| - Choose % of Grand Total: Displays values as a percentage of the overall total. |
| - Or choose % of Row Total or % of Column Total: Displays values as a percentage of the row or column total. |
| ::: |
| ## 6. Advanced Analysis in PivotTable |
| :::{.callout-important icon=false} ## 6.1 Using Slicers |
| - Go to Insert → Slicer: |
| - Select the field you want to use as a graphical filter. |
| - Click the slicer buttons to easily filter data in the PivotTable. ::: |
| :::{.callout-warning icon=false} ## 6.2 Adding Calculated Fields |
| - Use this to calculate values not included in the original data: |
| 1. Click inside the PivotTable → go to Analyze → Fields, Items & Sets → Calculated Field. |
2. Enter a name and a formula (e.g., = Sales * 1.07 to calculate tax). ::: |
6.3 Creating a PivotChart
Click on the PivotTable → go to Insert → PivotChart.
Choose the desired chart type, such as Column Chart or Pie Chart.
7.1 Adding New Data
If the source data has been updated:
Right-click on the PivotTable → choose Refresh.
If the new data is outside the original range, change the data source:
7.2 Deleting a PivotTable
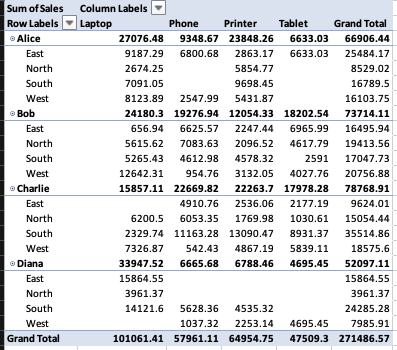
Delete.| Row Labels | Sum of Sales |
|---|---|
| Alice | 66906.44 |
| Bob | 73714.11 |
| Charlie | 78768.91 |
| Diana | 52097.11 |
| Grand Total | 271486.57 |
| Row Labels | Sum of Sales |
|---|---|
| Charlie | 78768.91 |
| Bob | 73714.11 |
| Alice | 66906.44 |
| Diana | 52097.11 |
| Grand Total | 271486.57 |
| Row Labels | Count of Product | Sum of Sales2 | Average of Sales |
|---|---|---|---|
| Diana | 17 | 52097.11 | 3064.535882 |
| Bob | 26 | 73714.11 | 2835.158077 |
| Charlie | 29 | 78768.91 | 2716.16931 |
| Alice | 28 | 66906.44 | 2389.515714 |
| Grand Total | 100 | 271486.57 | 2714.8657 |
| Row Labels | Sum of Sales |
|---|---|
| South | 93637.37 |
| East | 67468.67 |
| West | 63422.14 |
| North | 46958.39 |
| Grand Total | 271486.57 |
| Row Labels | Sum of Sales |
|---|---|
| South | 93637.37 |
| \(~~~~\)Tablet | 11522.37 |
| \(~~~~\)Phone | 21404.62 |
| \(~~~~\)Laptop | 28807.82 |
| \(~~~~\)Printer | 31902.56 |
| East | 67468.67 |
| \(~~~~\)Printer | 7646.67 |
| \(~~~~\)Tablet | 15776.21 |
| \(~~~~\)Phone | 18337.01 |
| \(~~~~\)Laptop | 25708.78 |
| West | 63422.14 |
| \(~~~~\)Phone | 5082.5 |
| \(~~~~\)Tablet | 14562.32 |
| \(~~~~\)Printer | 15684.25 |
| \(~~~~\)Laptop | 28093.07 |
| North | 46958.39 |
| \(~~~~\)Tablet | 5648.4 |
| \(~~~~\)Printer | 9721.27 |
| \(~~~~\)Phone | 13136.98 |
| \(~~~~\)Laptop | 18451.74 |
| Grand Total | 271486.57 |
| Row Labels | Average of Sales |
|---|---|
| South | 3228.874828 |
| North | 2762.258235 |
| West | 2536.8856 |
| East | 2326.505862 |
| Grand Total | 2714.8657 |
| Row Labels | Sum of Sales |
|---|---|
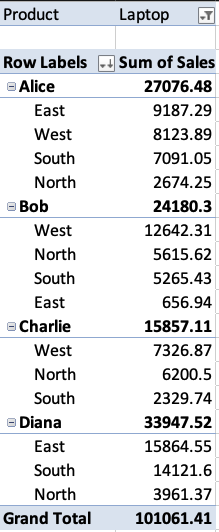
| Laptop | 101061.41 |
| Printer | 64954.75 |
| Phone | 57961.11 |
| Tablet | 47509.3 |
| Grand Total | 271486.57 |
| Row Labels | East | North | South | West | Grand Total |
|---|---|---|---|---|---|
| Laptop | 25708.78 | 18451.74 | 28807.82 | 28093.07 | 101061.41 |
| Printer | 7646.67 | 9721.27 | 31902.56 | 15684.25 | 64954.75 |
| Phone | 18337.01 | 13136.98 | 21404.62 | 5082.5 | 57961.11 |
| Tablet | 15776.21 | 5648.4 | 11522.37 | 14562.32 | 47509.3 |
| Grand Total | 67468.67 | 46958.39 | 93637.37 | 63422.14 | 271486.57 |
| Row Labels | Average of Sales |
|---|---|
| Laptop | 3158.169063 |
| Printer | 2598.19 |
| Tablet | 2500.489474 |
| Phone | 2415.04625 |
| Grand Total | 2714.8657 |
| Row Labels | Sum of Sales |
|---|---|
| South | 93637.37 |
| \(~~~~\)Charlie | 35514.86 |
| \(~~~~\)Diana | 24285.28 |
| \(~~~~\)Bob | 17047.73 |
| \(~~~~\)Alice | 16789.5 |
| East | 67468.67 |
| \(~~~~\)Alice | 25484.17 |
| \(~~~~\)Bob | 16495.94 |
| \(~~~~\)Diana | 15864.55 |
| \(~~~~\)Charlie | 9624.01 |
| West | 63422.14 |
| \(~~~~\)Bob | 20756.88 |
| \(~~~~\)Charlie | 18575.6 |
| \(~~~~\)Alice | 16103.75 |
| \(~~~~\)Diana | 7985.91 |
| North | 46958.39 |
| \(~~~~\)Bob | 19413.56 |
| \(~~~~\)Charlie | 15054.44 |
| \(~~~~\)Alice | 8529.02 |
| \(~~~~\) Diana | 3961.37 |
| Grand Total | 271486.57 |
| Row Labels | Sum of Sales |
|---|---|
| South | 93637.37 |
| North | 46958.39 |
| Difference | 46678.98 |
| Row Labels | Phone | Laptop | Difference |
|---|---|---|---|
| East | 18337.01 | 25708.78 | -7371.77 |
| North | 13136.98 | 18451.74 | -5314.76 |
| South | 21404.62 | 28807.82 | -7403.2 |
| West | 5082.5 | 28093.07 | -23010.57 |
| Row Labels | % of Grand Total | Sum of Sales |
|---|---|---|
| Alice | 22.91% | 36425.15 |
| Bob | 27.33% | 43457.24 |
| Charlie | 24.23% | 38526.93 |
| Diana | 25.54% | 40613.2 |
| Grand Total | 100.00% | 159022.52 |
Answer: 271,486.57 USD
Answer: Diana, 3,961.37 USD