Unsupervised Learning
การเรียนรู้แบบไม่มีผู้สอน
ผศ.ดร. สมศักดิ์ จันทร์เอม
วิทยาลัยนานาชาตินวัตกรรมดิจิทัล มหาวิทยาลัยเชียงใหม่
24 กันยายน 2569
การเรียนรู้แบบไม่มีผู้สอน
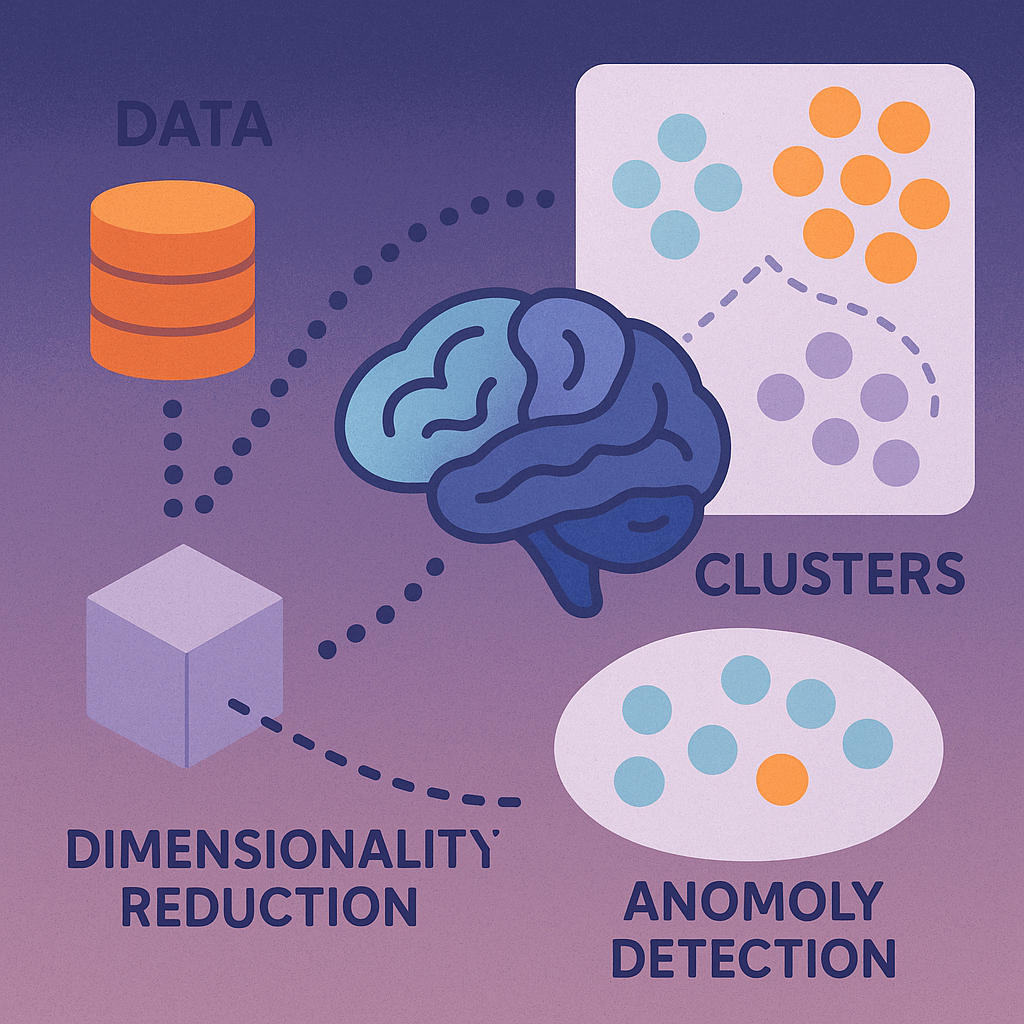
การเรียนรู้แบบไม่มีผู้สอน (Unsupervised Learning) เป็นหนึ่งในแนวทางของ การเรียนรู้ของเครื่อง (Machine Learning) ที่ใช้วิเคราะห์ข้อมูลโดย ไม่มีตัวแปรเป้าหมาย (ไม่มีฉลากกำกับ)
กล่าวอีกอย่างคือ แบบจำลองจะต้องค้นหา โครงสร้างหรือรูปแบบที่ซ่อนอยู่ในข้อมูลด้วยตัวเอง โดยไม่ได้รับคำบอกล่วงหน้า ว่าข้อมูลควรถูกจัดกลุ่มหรือมีความสัมพันธ์กันอย่างไร และในบางกรณี เราอาจไม่ทราบด้วยซ้ำว่า ควรมีจำนวนกลุ่มเท่าไร ในข้อมูล
วอร์มอัพ: สัตว์เหล่านี้ควรอยู่กลุ่มไหน?
ลองสังเกตสิ่งมีชีวิตเหล่านี้ หากต้องแบ่งพวก เราใช้อะไรเป็นเกณฑ์?
🦁
สิงโต
🐬
โลมา
🦅
นกอินทรี
🐸
กบ
🐕
สุนัข
🦈
ฉลาม
🦇
ค้างคาว
🐊
จระเข้
- มีกี่ขา?
- อยู่บนบกหรือในน้ำ?
- บินได้ไหม?
- เป็นสัตว์เลี้ยงหรือสัตว์ป่า?
นิยามคุณลักษณะ (Features)
ก่อนเข้าสู่อัลกอริทึม เราต้องแปลงสิ่งมีชีวิตให้เป็น Vector of Features
animals = [
  { icon: "🦁", name: "สิงโต", habitat: "บก", legs: 4, wings: 0, domestic: 0 },
  { icon: "🐕", name: "สุนัข", habitat: "บก", legs: 4, wings: 0, domestic: 1 },
  { icon: "🦅", name: "นกอินทรี", habitat: "บก", legs: 2, wings: 1, domestic: 0 },
  { icon: "🦇", name: "ค้างคาว", habitat: "บก", legs: 2, wings: 1, domestic: 0 },
  { icon: "🐬", name: "โลมา", habitat: "น้ำ", legs: 0, wings: 0, domestic: 0 },
  { icon: "🦈", name: "ฉลาม", habitat: "น้ำ", legs: 0, wings: 0, domestic: 0 },
  { icon: "🐸", name: "กบ", habitat: "ครึ่งบกครึ่งน้ำ", legs: 4, wings: 0, domestic: 0 },
  { icon: "🐊", name: "จระเข้", habitat: "ครึ่งบกครึ่งน้ำ", legs: 4, wings: 0, domestic: 0 }
]

habitatScore = ({ "บก": 1, "ครึ่งบกครึ่งน้ำ": 2, "น้ำ": 3 })
// สไตล์แก้ปัญหาสีหัวตาราง Inputs.table ใน Revealjs
html`
<style>
.custom-animal-table table thead tr th {
background-color: #1e293b !important;
color: #ffffff !important;
font-size: 0.95rem !important;
font-weight: 600 !important;
text-align: center !important;
padding: 8px 10px !important;
border-bottom: 2px solid #0f172a !important;
}
.custom-animal-table table tbody tr td {
font-size: 0.95rem !important;
text-align: center !important;
vertical-align: middle !important;
}
</style>
<div class="custom-animal-table">
${Inputs.table(animals.map(d => ({
"ตัวแทน": d.icon,
"ชื่อ": d.name,
"ถิ่นที่อยู่": d.habitat,
"จำนวนขา": d.legs,
"มีปีก (0/1)": d.wings,
"สัตว์เลี้ยง (0/1)": d.domestic
})), { rows: animals.length })}
</div>
`ทดลองจัดกลุ่ม (Interactive Clustering)
viewof selectedFeature = Inputs.select(
  [
    { label: "ถิ่นที่อยู่ (บก / น้ำ / ครึ่งบกครึ่งน้ำ)", value: "habitat" },
    { label: "จำนวนขา (0, 2, 4)", value: "legs" },
    { label: "ความสามารถในการบิน (มีปีก)", value: "wings" },
    { label: "ความคุ้นเคยกับคน (สัตว์เลี้ยง/ป่า)", value: "domestic" }
  ],
  { label: "เลือก Feature ที่ใช้แบ่ง:", format: d => d.label }
)

viewof kValue = Inputs.radio([2, 3], { label: "จำนวนกลุ่ม (k):", value: 2 })
clusteredData = {
const feat = selectedFeature.value;
return animals.map(d => {
let group = 0;
if (feat === "habitat") {
if (kValue === 2) {
group = d.habitat === "น้ำ" ? "กลุ่ม 2 (สัตว์น้ำ)" : "กลุ่ม 1 (บก/ครึ่งบกครึ่งน้ำ)";
} else {
group = d.habitat === "บก" ? "กลุ่ม 1 (บก)" : (d.habitat === "น้ำ" ? "กลุ่ม 2 (น้ำ)" : "กลุ่ม 3 (ครึ่งบกครึ่งน้ำ)");
}
} else if (feat === "legs") {
if (kValue === 2) {
group = d.legs >= 2 ? "กลุ่ม 1 (มีขา)" : "กลุ่ม 2 (ไม่มีขา/ว่ายน้ำ)";
} else {
group = d.legs === 4 ? "กลุ่ม 1 (4 ขา)" : (d.legs === 2 ? "กลุ่ม 2 (2 ขา)" : "กลุ่ม 3 (ไม่มีขา)");
}
} else if (feat === "wings") {
group = d.wings === 1 ? "กลุ่ม 1 (มีปีก)" : "กลุ่ม 2 (ไม่มีปีก)";
} else if (feat === "domestic") {
group = d.domestic === 1 ? "กลุ่ม 1 (สัตว์เลี้ยง)" : "กลุ่ม 2 (สัตว์ป่า)";
}
return { ...d, group };
});
}
// รวมกลุ่มสัตว์เพื่อแสดงผล
groups = d3.group(clusteredData, d => d.group)// แสดงผลลัพธ์เป็น Cards ตาม Cluster
// กำหนด max-width: 620px เพื่อให้การ์ดกว้าง 280px เรียงได้แถวละ 2 กล่อง เมื่อมีกลุ่มที่ 3 จะลงมาอยู่ข้างล่างตรงกลางพอดี
html`<div style="
display: flex;
flex-wrap: wrap;
gap: 20px;
justify-content: center;
max-width: 620px;
margin: 15px auto 0 auto;
">
${Array.from(groups).map(([grpName, members]) => html`
<div style="
background: #ffffff;
border: 2px solid #cbd5e1;
border-radius: 12px;
padding: 14px 16px;
width: 280px;
box-sizing: border-box;
text-align: center;
box-shadow: 0 4px 6px -1px rgba(0,0,0,0.07);
">
<h4 style="margin: 0 0 10px 0; color: #1e293b; font-size: 1.05rem; font-weight: bold;">${grpName}</h4>
<div style="font-size: 2.4rem; margin-bottom: 8px; display: flex; flex-wrap: wrap; justify-content: center; gap: 6px;">
${members.map(m => html`<span title="${m.name}">${m.icon}</span>`)}
</div>
<div style="font-size: 0.85rem; color: #64748b; line-height: 1.4;">
<strong>สมาชิก (${members.length}):</strong><br>${members.map(m => m.name).join(", ")}
</div>
</div>
`)}
</div>`หัวใจของ Clustering จากการสังเกต
- Unsupervised Learning: ไม่มีใครบอกป้ายกำกับ (Label) ล่วงหน้าว่าตัวไหนคือสัตว์ประเภทใด เราแบ่งพวกจาก ความคล้ายคลึง (Similarity) ของคุณลักษณะ
- Feature Space Matters: ถ้าเปลี่ยน Feature ที่ใช้พิจารณา (เช่น จาก “ถิ่นที่อยู่” เป็น “มีปีก”) สมาชิกในกลุ่มจะเปลี่ยนไปทันที (เช่น นกอินทรี 🦅 กับ ค้างคาว 🦇 จะมาอยู่กลุ่มเดียวกัน)
- Distance Metric: ในการคำนวณจริง คอมพิวเตอร์จะมองสัตว์แต่ละตัวเป็นพิกัด และวัดว่าตัวไหนอยู่ “ใกล้” หรือ “ไกล” กัน
หลักการของการเรียนรู้แบบไม่มีผู้สอน
แทนที่จะเรียนรู้จากตัวอย่างที่มีคำตอบกำหนดไว้ล่วงหน้า (labels) เหมือนในกรณีของ Supervised Learning ในกรณีของ Unsupervised Learning แบบจำลองจะทำงานโดยการ:
วิเคราะห์โครงสร้างของข้อมูล
ค้นหารูปแบบหรือความสัมพันธ์ที่ซ่อนอยู่ในข้อมูล
จัดกลุ่มข้อมูลที่มีลักษณะคล้ายกันไว้ด้วยกัน
ลดมิติของข้อมูล (Dimensionality Reduction) เพื่อทำให้การวิเคราะห์ง่ายขึ้น
ประเภทหลักของการเรียนรู้แบบไม่มีผู้สอน
1. การจัดกลุ่มข้อมูล (Clustering)
การจัดกลุ่ม (Clustering) จะจัดกลุ่มข้อมูลโดยอัตโนมัติ ให้ข้อมูลภายในกลุ่มเดียวกันมีความ คล้ายคลึงกัน (similar) และมีความ แตกต่าง (different) จากข้อมูลในกลุ่มอื่น
ตัวอย่างอัลกอริทึมที่ใช้ได้แก่:
- (k)-means clustering
- Hierarchical clustering
- DBSCAN (Density-Based Spatial Clustering)
2. การลดมิติของข้อมูล (Dimensionality Reduction)
ใช้เพื่อ ลดจำนวนตัวแปร (variables) ในข้อมูล โดยยังคงรักษาข้อมูลสำคัญให้ได้มากที่สุดเท่าที่เป็นไปได้
มีประโยชน์ในการแก้ปัญหา “คำสาปของมิติ (Curse of Dimensionality)” และช่วยให้แบบจำลองเรียนรู้ได้รวดเร็วขึ้น
ตัวอย่างอัลกอริทึมที่ใช้ได้แก่:
- PCA (Principal Component Analysis)
- t-SNE (t-Distributed Stochastic Neighbor Embedding)
- UMAP (Uniform Manifold Approximation and Projection)
3. การตรวจจับค่าผิดปกติ (Anomaly Detection)
ใช้ในการระบุค่าที่ เบี่ยงเบนจากรูปแบบปกติของข้อมูล เช่น การตรวจจับการฉ้อโกง (fraud detection) หรือการตรวจหาความผิดพลาดของระบบ
ตัวอย่างอัลกอริทึมที่ใช้ได้แก่:
- Isolation Forest
- One-Class SVM
- Autoencoders (ใน Deep Learning)
4. การเรียนรู้แบบกฎความสัมพันธ์ (Association Rule Learning)
ใช้เพื่อค้นหาความสัมพันธ์ระหว่างตัวแปรในชุดข้อมูล ตัวอย่างเช่น การวิเคราะห์ตะกร้าสินค้า (Market Basket Analysis) ซึ่งช่วยระบุสินค้าที่ลูกค้ามักจะซื้อตามกัน
ตัวอย่างอัลกอริทึมที่ใช้ได้แก่:
- Apriori
- FP-Growth
ตัวอย่างการประยุกต์ใช้การเรียนรู้แบบไม่มีผู้สอน
การแบ่งกลุ่มลูกค้า (Customer Segmentation) ธุรกิจสามารถใช้เทคนิคการจัดกลุ่ม (clustering) เพื่อแบ่งกลุ่มลูกค้าตามพฤติกรรมการซื้อ เช่น กลุ่มลูกค้าประจำ ลูกค้าใหม่ หรือกลุ่มที่เลิกใช้บริการแล้ว
การวิเคราะห์หัวข้อ (Topic Modeling) การเรียนรู้แบบไม่มีผู้สอนสามารถใช้ในการวิเคราะห์และจัดกลุ่มบทความหรือรีวิว ตัวอย่างเช่น อัลกอริทึม LDA (Latent Dirichlet Allocation) ใช้ในการจำแนกประเภทของเอกสาร
การตรวจจับการฉ้อโกง (Fraud Detection) เทคนิคการตรวจจับค่าผิดปกติ (Anomaly Detection) ช่วยระบุธุรกรรมที่น่าสงสัย เช่น การใช้บัตรเครดิตในสถานที่ต่างกันมากภายในช่วงเวลาสั้น ๆ
การลดมิติของข้อมูล (Dimensionality Reduction) เทคนิค PCA สามารถใช้เพื่อลดจำนวนตัวแปรก่อนนำข้อมูลเข้าสู่แบบจำลอง Machine Learning ช่วยทำให้กระบวนการวิเคราะห์และการเรียนรู้มีประสิทธิภาพและเข้าใจง่ายขึ้น
ข้อดีและข้อจำกัดของการเรียนรู้แบบไม่มีผู้สอน
ข้อดี (Advantages)
ไม่จำเป็นต้องใช้ข้อมูลที่มีฉลาก (labeled data) ช่วยลดต้นทุนในการเตรียมข้อมูล
สามารถค้นหารูปแบบหรือโครงสร้างที่ซ่อนอยู่ในข้อมูลได้โดยอัตโนมัติ
ทำงานได้ดีเมื่อข้อมูลมีขนาดใหญ่และซับซ้อน
มีประโยชน์ในการค้นพบความรู้ใหม่ ๆ ที่มนุษย์อาจมองไม่เห็นได้ง่าย
ข้อจำกัด (Disadvantages)
ผลลัพธ์มักตีความได้ยากกว่าเมื่อเทียบกับการเรียนรู้แบบมีผู้สอน (Supervised Learning)
การกำหนดจำนวนกลุ่ม (clusters) หรือการตั้งค่าพารามิเตอร์บางอย่าง จำเป็นต้องอาศัยความเชี่ยวชาญของผู้ใช้งาน
อาจทำงานได้ไม่ดีหากข้อมูลมีสัญญาณรบกวน (noise) มาก หรือข้อมูลไม่ได้รับการเตรียมอย่างเหมาะสม
Interactive: Clustering
(async () => {

  // ====== UI skeleton ======
  const box = html`<div style="max-width:1080px;font:14px system-ui;">
    <div id="ctrl" style="display:grid;grid-template-columns:repeat(3,minmax(0,1fr));gap:10px;margin-bottom:10px;"></div>
    <div id="plot"></div>
    <div id="dash" style="display:grid;grid-template-columns:repeat(2,minmax(0,1fr));gap:10px;margin-top:10px;"></div>
    <div id="note" style="margin-top:6px;color:#444"></div>
  </div>`;
  const ctrl    = box.querySelector("#ctrl");
  const plotDiv = box.querySelector("#plot");
  const dash    = box.querySelector("#dash");
  const note    = box.querySelector("#note");

  // ====== Controls ======
  const algoS     = Inputs.select(["DBSCAN","K-means","Hierarchical"], {value:"DBSCAN", label:"Algorithm"});
  const seedS     = Inputs.range([1,9999],  {value: 1234, step: 1,    label: "Seed"});
  const nS        = Inputs.range([100,800], {value: 400,  step: 50,   label: "Points (n)"});
  const shapeS    = Inputs.select(["blobs","moons","circles"], {value:"circles", label:"Dataset"});
  const noiseS    = Inputs.range([0,0.3],   {value: 0.02, step: 0.01, label: "Noise ratio"});

  // K-means (no Max iters control; fixed at 50)
  const kS         = Inputs.range([2,12],   {value: 3,  step: 1, label: "k (K-means)"});
  const showElbow  = Inputs.toggle({label: "Show Elbow & Silhouette (K-means)", value: true});

  // DBSCAN
  const epsS      = Inputs.range([0.02,0.5],{value: 0.045, step: 0.005, label: "ε (eps)"});
  const minPtsS   = Inputs.range([3,30],    {value: 10,    step: 1,     label: "minPts"});
  const showKDist = Inputs.toggle({label: "Show k-distance (DBSCAN)", value: true});

  // Hierarchical
  const hkS        = Inputs.range([2,12],   {value: 3, step: 1, label: "k (Hierarchical)"});
  const linkageS   = Inputs.select(["single","complete","average","ward"], {value:"single", label:"Linkage"});

  const btnRes  = Inputs.button("Resample");

  // ====== Layout (3 columns) ======
  const col1 = html`<div></div>`;
  const col2 = html`<div></div>`;
  const col3 = html`<div></div>`;

  // Column 1: general
  col1.append(algoS, seedS, nS, shapeS, noiseS);

  // Column 2: DBSCAN block -> K-means block
  col2.append(
    epsS, minPtsS, showKDist,
    kS
  );

  // Column 3: Hierarchical + Resample + Show Elbow
  col3.append(
    hkS, linkageS,
    btnRes,
    showElbow
  );

  ctrl.append(col1, col2, col3);

  // ====== Utils ======
  const TAU = 2*Math.PI;
  const clamp = (x,a,b)=> Math.max(a, Math.min(b,x));
  function mulberry32(a){ return function(){ let t=a+=0x6D2B79F5; t=Math.imul(t^t>>>15,t|1); t^=t+Math.imul(t^t>>>7,t|61); return ((t^t>>>14)>>>0)/4294967296 } }
  function rnorm(rng, m=0, s=1){ let u=0,v=0; while(u===0) u=rng(); while(v===0) v=rng(); return m + s*Math.sqrt(-2*Math.log(u))*Math.cos(TAU*v); }
  function dist(a,b){ return Math.hypot(a.x-b.x, a.y-b.y); }
  function dist2(a,b){ const dx=a.x-b.x, dy=a.y-b.y; return dx*dx+dy*dy; }
  const colorFor = (cid)=> cid<0 ? "#888" : `hsl(${(cid*65)%360} 70% 45%)`;

  // ====== Data generators ======
  function genBlobs(n, rng){
    const k=3, centers = [{x:0.25,y:0.3},{x:0.7,y:0.35},{x:0.5,y:0.75}], sds=[0.06,0.07,0.05];
    const arr = [];
    for(let i=0;i<n;i++){
      const c = (rng()*k)|0;
      arr.push({ x: clamp(rnorm(rng, centers[c].x, sds[c]), 0,1),
                 y: clamp(rnorm(rng, centers[c].y, sds[c]), 0,1) });
    }
    return arr;
  }
  function genMoons(n, rng){
    const arr = [];
    for(let i=0;i<n;i++){
      const t = rng()*Math.PI;
      if(i<n/2){
        const r=0.28, cx=0.35, cy=0.5;
        const x = cx + r*Math.cos(t) + r*0.12*rnorm(rng);
        const y = cy + r*Math.sin(t) + r*0.12*rnorm(rng);
        arr.push({x: clamp(x,0,1), y: clamp(y,0,1)});
      }else{
        const r=0.28, cx=0.65, cy=0.5;
        const x = cx + r*Math.cos(t+Math.PI) + r*0.12*rnorm(rng);
        const y = cy + r*Math.sin(t+Math.PI) + r*0.12*rnorm(rng);
        arr.push({x: clamp(x,0,1), y: clamp(y,0,1)});
      }
    }
    return arr;
  }
  function genCircles(n, rng){
    const n1 = Math.floor(n/2), n2 = n - n1;
    const cx=0.5, cy=0.5;
    const r1 = 0.20, r2 = 0.40;
    const sRad = 0.010, sTan = 0.010;
    const pts = [];
    for (let i=0; i<n1; i++){
      const a  = rng()*2*Math.PI;
      const rr = r1 + sRad*rnorm(rng);
      pts.push({ x: clamp(cx + rr*Math.cos(a) + sTan*rnorm(rng), 0,1),
                 y: clamp(cy + rr*Math.sin(a) + sTan*rnorm(rng), 0,1) });
    }
    for (let i=0; i<n2; i++){
      const a  = rng()*2*Math.PI;
      const rr = r2 + sRad*rnorm(rng);
      pts.push({ x: clamp(cx + rr*Math.cos(a) + sTan*rnorm(rng), 0,1),
                 y: clamp(cy + rr*Math.sin(a) + sTan*rnorm(rng), 0,1) });
    }
    return pts;
  }
  function addNoise(points, rng, ratio){
    const k = Math.round(points.length*ratio);
    for(let i=0;i<k;i++) points.push({x:rng(), y:rng(), noise:true});
    return points;
  }

  // ====== DBSCAN ======
  function dbscan(points, eps, minPts){
    const n = points.length, eps2 = eps*eps;
    const visited = new Array(n).fill(false);
    const assigned= new Array(n).fill(false);
    const isCore  = new Array(n).fill(false);
    const neighbors = new Array(n);

    for(let i=0;i<n;i++){
      const neigh = [];
      for(let j=0;j<n;j++){
        if(i===j) continue;
        if(dist2(points[i], points[j]) <= eps2) neigh.push(j);
      }
      neighbors[i] = neigh;
      if(neigh.length+1 >= minPts) isCore[i] = true;
    }

    let clusterId = 0;
    const labels = new Array(n).fill(-1);

    for(let i=0;i<n;i++){
      if(visited[i]) continue;
      visited[i]=true;
      if(!isCore[i]) continue;

      labels[i] = clusterId;
      assigned[i]=true;

      const queue=[...neighbors[i]];
      while(queue.length){
        const q = queue.pop();
        if(!visited[q]){
          visited[q]=true;
          if(isCore[q]) queue.push(...neighbors[q]);
        }
        if(!assigned[q]){
          labels[q]=clusterId;
          assigned[q]=true;
        }
      }
      clusterId++;
    }

    for(let i=0;i<n;i++){
      if(assigned[i]) continue;
      let cid = -1;
      for(const j of neighbors[i]){
        if(isCore[j] && labels[j]!==-1){ cid = labels[j]; break; }
      }
      labels[i] = cid;
    }

    return points.map((p, idx) => ({
      ...p,
      cid: labels[idx],
      core: isCore[idx],
      noise: labels[idx]===-1
    }));
  }

  // ====== K-distance helper ======
  function kDistance(points, k){
    const arr = [];
    for(let i=0;i<points.length;i++){
      const dists = [];
      for(let j=0;j<points.length;j++){
        if(i===j) continue;
        dists.push(dist(points[i], points[j]));
      }
      dists.sort((a,b)=>a-b);
      const kth = dists[Math.max(0, Math.min(k-1, dists.length-1))];
      arr.push(kth);
    }
    arr.sort((a,b)=> b-a);
    return arr.map((v,i)=> ({i, v}));
  }

  // ====== K-means (k-means++ init) ======
  function kmeansPPInit(points, k, rng){
    const n = points.length;
    const centers = [];
    centers.push(points[(rng()*n)|0]);
    const d2 = new Array(n).fill(0);
    while(centers.length < k){
      for(let i=0;i<n;i++){
        let best = Infinity;
        for(const c of centers){
          const vv = dist2(points[i], c);
          if(vv<best) best = vv;
        }
        d2[i] = best;
      }
      const sum = d2.reduce((s,x)=>s+x,0) || 1e-12;
      let r = rng()*sum;
      let pick = 0;
      for(let i=0;i<n;i++){ r -= d2[i]; if(r<=0){ pick=i; break; } }
      centers.push({x: points[pick].x, y: points[pick].y});
    }
    return centers;
  }
  function inertia(points, labels, centers){
    let tot=0;
    for(let i=0;i<points.length;i++){
      const c = centers[labels[i]];
      tot += dist2(points[i], c);
    }
    return tot;
  }
  function kmeans(points, k, maxIters, rng){
    const n = points.length;
    k = Math.max(1, Math.min(k, n));
    let centers = kmeansPPInit(points, k, rng).map(c => ({x:c.x, y:c.y}));
    let labels  = new Array(n).fill(0);

    for(let iter=0; iter<maxIters; iter++){
      let changed = false;
      for(let i=0;i<n;i++){
        let best=-1, bestd=Infinity;
        for(let c=0;c<k;c++){
          const d = dist2(points[i], centers[c]);
          if(d < bestd){ bestd=d; best=c; }
        }
        if(labels[i] !== best){ labels[i]=best; changed = true; }
      }
      const sum = Array.from({length:k}, _ => ({x:0,y:0,c:0}));
      for(let i=0;i<n;i++){ const c=labels[i]; sum[c].x += points[i].x; sum[c].y += points[i].y; sum[c].c++; }
      for(let c=0;c<k;c++){
        if(sum[c].c>0){
          centers[c].x = sum[c].x / sum[c].c;
          centers[c].y = sum[c].y / sum[c].c;
        }
      }
      if(!changed) break;
    }
    const labeled = points.map((p,i)=> ({...p, cid: labels[i], core:false, noise:false}));
    const I = inertia(points, labels, centers);
    return {labeled, centers, inertia: I};
  }

  // ====== Hierarchical core (agglomerative) ======
  function agglomerative(points, linkage="single"){
    const n = points.length;
    const size = [], alive = [], centroid = [];
    for(let i=0;i<n;i++){ size[i]=1; alive[i]=true; centroid[i]={x:points[i].x, y:points[i].y}; }

    const N = 2*n-1;
    const distMat = Array.from({length:N}, _ => new Map());
    function setD(i,j,val){ if(i>j){const t=i;i=j;j=t;} distMat[i].set(j,val); }
    function getD(i,j){ if(i===j) return 0; if(i>j){const t=i;i=j;j=t;} return distMat[i].get(j); }

    const useSq = (linkage==="ward");
    for(let i=0;i<n;i++){
      for(let j=i+1;j<n;j++){
        const d = useSq ? dist2(points[i], points[j]) : dist(points[i], points[j]);
        setD(i,j,d);
      }
    }

    const merges = [];
    let nextId = n;

    function pickMin(){
      let bi=-1, bj=-1, bd=Infinity;
      for(let i=0;i<nextId;i++){
        if(!alive[i]) continue;
        const row = distMat[i];
        for(const [j,d] of row){
          if(j>=nextId || !alive[j]) continue;
          if(d < bd){ bd=d; bi=i; bj=j; }
        }
      }
      return [bi,bj,bd];
    }

    while(true){
      let aliveCnt=0;
      for(let i=0;i<nextId;i++) if(alive[i]) aliveCnt++;
      if(aliveCnt<=1) break;

      const [i,j,d] = pickMin();
      if(i===-1) break;

      const m = nextId++;
      alive[i]=false; alive[j]=false; alive[m]=true;
      const si=size[i], sj=size[j];
      size[m]=si+sj;
      centroid[m] = { x:(centroid[i].x*si + centroid[j].x*sj)/(si+sj),
                      y:(centroid[i].y*si + centroid[j].y*sj)/(si+sj) };
      const height = (linkage==="ward") ? Math.sqrt(d) : d;
      merges.push({left:i, right:j, height, newId:m, size:size[m]});

      for(let k=0;k<nextId;k++){
        if(!alive[k] || k===m) continue;
        let dik = getD(i,k), djk = getD(j,k);
        if(dik===undefined) dik = (linkage==="ward") ? dist2(centroid[i], centroid[k]) : dist(centroid[i], centroid[k]);
        if(djk===undefined) djk = (linkage==="ward") ? dist2(centroid[j], centroid[k]) : dist(centroid[j], centroid[k]);

        let dm;
        if(linkage==="single"){
          dm = Math.min(dik, djk);
        } else if(linkage==="complete"){
          dm = Math.max(dik, djk);
        } else if(linkage==="average"){
          dm = (si/(si+sj))*dik + (sj/(si+sj))*djk;
        } else { // ward
          const sk = size[k];
          dm = ((si+sk)/(si+sj+sk))*dik + ((sj+sk)/(si+sj+sk))*djk - (sk/(si+sj+sk))*getD(i,j);
        }
        setD(m,k, dm);
      }
    }
    return {merges, nLeaves:n};
  }

  // ====== Label helpers ======
  function relabelConsecutive(points){
    const map = new Map(); let next=0;
    return points.map(p => {
      if(!map.has(p.cid)) map.set(p.cid, next++);
      return {...p, cid: map.get(p.cid)};
    });
  }
  function centroidsFromLabels(points, K){
    const cents = Array.from({length:K}, _=>({x:0,y:0,c:0}));
    for(const p of points){ const k=p.cid; if(k>=0 && k<K){ cents[k].x+=p.x; cents[k].y+=p.y; cents[k].c++; } }
    for(const c of cents){ if(c.c>0){ c.x/=c.c; c.y/=c.c; } else { c.x=NaN; c.y=NaN; } }
    return cents;
  }
  function centroidOfCluster(points, cid){
    let sx=0, sy=0, c=0;
    for(const p of points) if(p.cid===cid){ sx+=p.x; sy+=p.y; c++; }
    return c>0 ? {x:sx/c,y:sy/c,c} : {x:NaN,y:NaN,c:0};
  }

  // ====== Force exactly K clusters for Hierarchical ======
  function enforceExactK(labeled, K){
    labeled = relabelConsecutive(labeled);
    let m = new Set(labeled.map(p=>p.cid)).size;

    const counts = () => {
      const mapC = new Map();
      for (const p of labeled) mapC.set(p.cid, (mapC.get(p.cid)||0)+1);
      return mapC;
    };

    while (m < K){
      const cnt = counts();
      let big=-1, bs=-1;
      for(const [cid, c] of cnt){ if(c>bs){ bs=c; big=cid; } }
      if (big===-1) break;
      const cent = centroidOfCluster(labeled, big);
      let farIdx=-1, farD=-1;
      for(let i=0;i<labeled.length;i++){
        if(labeled[i].cid!==big) continue;
        const d = dist(labeled[i], cent);
        if(d>farD){ farD=d; farIdx=i; }
      }
      const newId = Math.max(...labeled.map(p=>p.cid))+1;
      if (farIdx>=0) labeled[farIdx] = {...labeled[farIdx], cid:newId};
      labeled = relabelConsecutive(labeled);
      m = new Set(labeled.map(p=>p.cid)).size;
    }

    while (m > K){
      const curIds = Array.from(new Set(labeled.map(p=>p.cid))).sort((a,b)=>a-b);
      const cents = curIds.map(cid => ({cid, ...centroidOfCluster(labeled, cid)}));
      let pa=-1, pb=-1, best=Infinity;
      for(let i=0;i<cents.length;i++){
        for(let j=i+1;j<cents.length;j++){
          const d = dist(cents[i], cents[j]);
          if(d<best){ best=d; pa=cents[i].cid; pb=cents[j].cid; }
        }
      }
      if (pa===-1 || pb===-1) break;
      labeled = labeled.map(p => p.cid===pb ? ({...p, cid: pa}) : p);
      labeled = relabelConsecutive(labeled);
      m = new Set(labeled.map(p=>p.cid)).size;
    }
    labeled = relabelConsecutive(labeled);
    return labeled;
  }

  // ====== Helper charts ======
  function renderKDistance(points, k){
    const arr = kDistance(points, k);
    return Plot.plot({
      width: 520, height: 220, marginLeft: 50, marginBottom: 40,
      x: {label: "points sorted (desc)"},
      y: {label: k + "-NN distance"},
      marks: [ Plot.line(arr, {x:"i", y:"v"}), Plot.dot(arr, {x:"i", y:"v", r:1.5}) ]
    });
  }

  function computeElbowAndSil(points, rng, maxIter=50){
    const ks = Array.from({length: 11}, (_,i)=> i+2); // 2..12
    const elbow = [];
    const sil   = [];
    for(const kk of ks){
      const {labeled, centers, inertia: I} = kmeans(points, kk, maxIter, rng);
      elbow.push({k: kk, inertia: I});
      const SAMP = Math.min(400, labeled.length);
      let step = Math.max(1, Math.floor(labeled.length / SAMP));
      let sumS = 0, cnt=0;
      for(let i=0;i<labeled.length; i+=step){
        const p = labeled[i], ci = p.cid;
        let a=0, aN=0, b=Infinity;
        for(let j=0;j<labeled.length;j++){
          if(i===j) continue;
          const d = dist(p, labeled[j]);
          if(labeled[j].cid === ci){ a += d; aN++; }
        }
        if(aN>0) a /= aN; else a = 0;
        const kmax = Math.max(...labeled.map(d=>d.cid));
        for(let cj=0; cj<=kmax; cj++){
          if(cj===ci) continue;
          let sum=0, n=0;
          for(let j=0;j<labeled.length;j++){
            if(labeled[j].cid===cj){ sum += dist(p, labeled[j]); n++; }
          }
          if(n>0){ const avg=sum/n; if(avg < b) b=avg; }
        }
        if(!isFinite(b)) b = a;
        const s = (b - a) / Math.max(a, b, 1e-12);
        sumS += s; cnt++;
      }
      sil.push({k: kk, s: (cnt ? sumS/cnt : 0)});
    }
    return {elbow, sil};
  }

  // ✅ These were missing:
  function renderElbow(elbow){
    return Plot.plot({
      width: 520, height: 220, marginLeft: 56, marginBottom: 40,
      x: {label: "k"}, y: {label: "inertia (lower is better)"},
      marks: [ Plot.line(elbow, {x:"k", y:"inertia"}), Plot.dot(elbow, {x:"k", y:"inertia"}) ]
    });
  }
  function renderSil(sil){
    return Plot.plot({
      width: 520, height: 220, marginLeft: 56, marginBottom: 40,
      x: {label: "k"}, y: {label: "silhouette (−1..1; higher is better)"},
      marks: [ Plot.line(sil, {x:"k", y:"s"}), Plot.dot(sil, {x:"k", y:"s"}) ]
    });
  }

  // ====== DRAW ======
  let resampleNonce = 0; // ensures Resample always changes data even with same Seed

  function draw(){
    const rng = mulberry32((seedS.value|0) ^ (resampleNonce*0x9e3779b9));
    const n   = nS.value|0;
    const shape = shapeS.value;
    const noiseRatio = noiseS.value;

    // data
    let pts;
    if (shape === "blobs")      pts = genBlobs(n, rng);
    else if (shape === "moons") pts = genMoons(n, rng);
    else                        pts = genCircles(n, rng);
    addNoise(pts, rng, noiseRatio);

    const algo = algoS.value;
    let labeled;
    let info = "";
    let kmeansCenters = null;

    if (algo === "DBSCAN"){
      labeled = dbscan(pts, epsS.value, minPtsS.value);
      const kFound = Math.max(-1, ...labeled.map(d=>d.cid)) + 1;
      const coreCnt = labeled.filter(d=>d.core).length;
      const noiseCnt= labeled.filter(d=>d.cid===-1).length;
      info = `Clusters: <b>${kFound}</b> | Core: ${coreCnt} | Noise: ${noiseCnt}
              <span style="color:#666"> (ε=${epsS.value.toFixed(3)}, minPts=${minPtsS.value}, n=${labeled.length}, ${shape})</span>`;
    } else if (algo === "K-means"){
      const out = kmeans(pts, kS.value|0, 50, rng); // fixed 50 iterations
      labeled = out.labeled;
      kmeansCenters = out.centers;
      const kFound = Math.max(-1, ...labeled.map(d=>d.cid)) + 1;
      info = `Clusters (K-means++, 50 iters): <b>${kFound}</b> | Inertia: ${out.inertia.toFixed(2)}
              <span style="color:#666"> (k=${kS.value}, n=${labeled.length}, ${shape})</span>`;
    } else {
      const linkage = linkageS.value;
      const K = hkS.value|0;

      const ptsCopy = pts; // use full set or subset inside agglomerative section
      const maxHC = 600;
      if (ptsCopy.length <= maxHC) {
        const {merges, nLeaves} = agglomerative(ptsCopy, linkage);
        const edges = merges.map(m => ({u:m.left, v:m.right, h:m.height})).sort((a,b)=> b.h - a.h);
        const cuts = new Set(); for(let i=0;i<Math.min(K-1, edges.length); i++) cuts.add(i);

        const parentUF = Array.from({length:2*nLeaves},(_,i)=> i);
        function find(x){ while(parentUF[x]!==x){ parentUF[x]=parentUF[parentUF[x]]; x=parentUF[x]; } return x; }
        function unite(a,b){ a=find(a); b=find(b); if(a!==b) parentUF[b]=a; }
        for(let idx=edges.length-1; idx>=0; idx--){ if(cuts.has(idx)) continue; const e = edges[idx]; unite(e.u, e.v); }
        const root2id = new Map(); let next=0;
        const labels = new Array(nLeaves);
        for(let i=0;i<nLeaves;i++){ const r = find(i); if(!root2id.has(r)) root2id.set(r, next++); labels[i] = root2id.get(r); }
        labeled = ptsCopy.map((p,i)=> ({...p, cid: labels[i], core:false, noise:false}));
        labeled = enforceExactK(labeled, K);
      } else {
        const rngLoc = mulberry32(((seedS.value|0) ^ (resampleNonce*0x9e3779b9)) + 0xabc123);
        const idxs = Array.from({length:ptsCopy.length}, (_,i)=>i);
        for(let i=idxs.length-1;i>0;i--){ const j=(rngLoc()*(i+1))|0; [idxs[i],idxs[j]]=[idxs[j],idxs[i]]; }
        const take = idxs.slice(0, maxHC);
        const sub  = take.map(i => ptsCopy[i]);

        const {merges, nLeaves} = agglomerative(sub, linkage);
        const edges = merges.map(m => ({u:m.left, v:m.right, h:m.height})).sort((a,b)=> b.h - a.h);
        const cuts = new Set(); for(let i=0;i<Math.min(K-1, edges.length); i++) cuts.add(i);
        const parentUF = Array.from({length:2*nLeaves},(_,i)=> i);
        function find(x){ while(parentUF[x]!==x){ parentUF[x]=parentUF[parentUF[x]]; x=parentUF[x]; } return x; }
        function unite(a,b){ a=find(a); b=find(b); if(a!==b) parentUF[b]=a; }
        for(let idx=edges.length-1; idx>=0; idx--){ if(cuts.has(idx)) continue; const e = edges[idx]; unite(e.u, e.v); }
        const root2id = new Map(); let next=0;
        const labelsSub = new Array(nLeaves);
        for(let i=0;i<nLeaves;i++){ const r = find(i); if(!root2id.has(r)) root2id.set(r, next++); labelsSub[i] = root2id.get(r); }
        let labeledSub = sub.map((p,i)=> ({...p, cid: labelsSub[i], core:false, noise:false}));
        labeledSub = relabelConsecutive(labeledSub);

        let cents = centroidsFromLabels(labeledSub, K);
        for(let i=0;i<cents.length;i++){
          if(!isFinite(cents[i].x) || !isFinite(cents[i].y)){
            const r = (rngLoc()*sub.length)|0;
            cents[i] = {x: sub[r].x, y: sub[r].y, c:1};
          }
        }

        labeled = ptsCopy.map(p=>{
          let best=-1, bd=Infinity;
          for(let cId=0;cId<K;cId++){
            const c = cents[cId];
            const d = (p.x-c.x)*(p.x-c.x) + (p.y-c.y)*(p.y-c.y);
            if(d<bd){ bd=d; best=cId; }
          }
          return {...p, cid: best, core:false, noise:false};
        });

        labeled = enforceExactK(labeled, K);
      }

      const kFound = new Set(labeled.map(d=>d.cid)).size;
      info = `Clusters (Hierarchical, ${linkage}): <b>${kFound}</b>
              <span style="color:#666"> (k=${hkS.value}, n=${labeled.length}, ${shape})</span>`;
    }

    // ====== Render main scatter ======
    plotDiv.innerHTML = "";
    const marks = [];
    if (algo === "DBSCAN"){
      marks.push(Plot.dot(labeled.filter(d=>d.cid===-1), {x:"x", y:"y", r:2.8, fill:"#bbb", stroke:"white", title: d=> "noise"}));
      marks.push(Plot.dot(labeled.filter(d=>d.cid!==-1 && !d.core), {x:"x", y:"y", r:3.3, fill: d=> colorFor(d.cid), stroke:"white", title: d=>`cluster ${d.cid} (border)`}));
      marks.push(Plot.dot(labeled.filter(d=>d.core && d.cid!==-1), {x:"x", y:"y", r:4.8, fill: d=> colorFor(d.cid), stroke:"black", title: d=>`cluster ${d.cid} (core)`}));
      marks.push(Plot.text([{x:0.06,y:0.94,label:"● core, ● border, ○ noise"}], {x:"x",y:"y",text:"label",dy:-8,fill:"#444"}));
    } else {
      marks.push(Plot.dot(labeled, {x:"x", y:"y", r:3.6, fill: d=> colorFor(d.cid), stroke:"white", title: d=>`cluster ${d.cid}`}));
      if (algo === "K-means" && Array.isArray(kmeansCenters)){
        marks.push(Plot.dot(kmeansCenters, {x:"x", y:"y", r:7.5, fill:"white", stroke:"black", strokeWidth:2}));
        marks.push(Plot.text(kmeansCenters.map(c => ({x:c.x, y:c.y, label:"×"})), {x:"x", y:"y", text:"label", dy:3, fill:"black"}));
      }
    }
    plotDiv.append(Plot.plot({
      width: 1060, height: 560, marginLeft: 56, marginBottom: 44,
      x: {domain: [0,1], grid: true, label: "x₁"},
      y: {domain: [0,1], grid: true, label: "x₂"},
      marks
    }));

    // ====== Helper dashboard ======
    dash.innerHTML = "";
    if (algo === "DBSCAN" && showKDist.value){
      dash.append(renderKDistance(pts, minPtsS.value|0));
      dash.append(html`<div style="align-self:center;color:#666;">Tip: Set ε near the “elbow point” of the graph.</div>`);
    } else if (algo === "K-means" && showElbow.value){
      const {elbow, sil} = computeElbowAndSil(pts, mulberry32((seedS.value|0) ^ (resampleNonce*0x9e3779b9) ^ 0x517cc1), 50);
      dash.append(renderElbow(elbow));
      dash.append(renderSil(sil));
    }

    // ====== Note & soften irrelevant controls ======
    note.innerHTML = info + (resampleNonce>0 ? ` <span style="color:#0a7">• resampled×${resampleNonce}</span>` : "");

    const isDB = (algo==="DBSCAN"), isKM=(algo==="K-means"), isHC=(algo==="Hierarchical");
    epsS.style.opacity      = isDB ? 1 : 0.35;
    minPtsS.style.opacity   = isDB ? 1 : 0.35;
    showKDist.style.opacity = isDB ? 1 : 0.2;

    kS.style.opacity        = isKM ? 1 : 0.35;

    hkS.style.opacity       = isHC ? 1 : 0.35;
    linkageS.style.opacity  = isHC ? 1 : 0.35;
  }

  // events
  [algoS,seedS,nS,shapeS,noiseS,kS,epsS,minPtsS,showKDist,hkS,linkageS,showElbow]
    .forEach(el => el.addEventListener("input", draw));

  // Resample always changes RNG stream even if Seed unchanged
  btnRes.addEventListener("click", () => { resampleNonce++; draw(); });

  // initial
  draw();
  return box;
})()
K-Means Clustering
Clustering with -means (K-Means Clustering)
viewof xvar = Inputs.radio(["Sepal.Length","Sepal.Width","Petal.Length","Petal.Width"], {label: "X-axis", value: "Sepal.Length"});
viewof yvar = Inputs.radio(["Sepal.Length","Sepal.Width","Petal.Length","Petal.Width"], {label: "Y-axis", value: "Sepal.Width"});
viewof k = Inputs.range([1, 6], { value: 3, step: 1, label: "Number of Cluster (k)" })
viewof clicks3 = Inputs.button("Click to Show the clusters")-means clustering เป็นหนึ่งในเทคนิคที่ได้รับความนิยมมากที่สุดสำหรับ การจัดกลุ่มข้อมูล (Clustering) ในกระบวนการ การเรียนรู้แบบไม่มีผู้สอน (Unsupervised Learning)
หลักการทำงานคือการแบ่งข้อมูลออกเป็น กลุ่ม ตามความคล้ายคลึงกันของข้อมูล โดยแต่ละกลุ่มจะมีจุดศูนย์กลางของตนเอง (centroid) ซึ่งเป็นตัวแทนของกลุ่มนั้น
How -means Works
flowchart TD
    A["Start"]
    B["Set number of<br/>clusters k"]
    C["Initialize<br/>k centroids"]
    D["Compute distances<br/>to centroids"]
    E["Assign each point to<br/>nearest centroid"]
    F["Update centroids<br/>using cluster means"]
    G{"Converged or<br/>max iterations<br/>reached?"}
    H["Stop"]
    I["Output cluster labels<br/>and final centroids"]

    A --> B
    B --> C
    C --> D
    D --> E
    E --> F
    F --> G
    G -- Yes --> H
    G -- No --> D
    H --> I
กำหนดจำนวนกลุ่ม :
ผู้ใช้งานระบุจำนวนกลุ่มที่ต้องการจัดกลุ่มข้อมูลกำหนดจุดศูนย์กลางเริ่มต้น (Centroids):
เลือกจุดศูนย์กลางเริ่มต้นจำนวน จุด เช่น สุ่มเลือกจากจุดข้อมูล หรือใช้วิธี K-means++คำนวณระยะทางและจัดกลุ่มข้อมูล:
คำนวณระยะทางแบบยูคลิด (Euclidean Distance) และจัดแต่ละจุดให้อยู่ในกลุ่มที่มี Centroid ใกล้ที่สุดอัปเดตตำแหน่งจุดศูนย์กลาง:
คำนวณ Centroid ใหม่จากค่าเฉลี่ยของจุดข้อมูล ทั้งหมดภายในแต่ละกลุ่มทำซ้ำจนเข้าสู่ภาวะคงที่ (Convergence):
ทำซ้ำขั้นตอนที่ 3 และ 4 จนกว่าผลการจัดกลุ่ม หรือ Centroid จะไม่เปลี่ยนแปลงอย่างมีนัยสำคัญ หรือถึงจำนวนรอบสูงสุดที่กำหนด
Objective Function: Minimize Within-Cluster Sum of Squares
โดยที่ คือคลัสเตอร์ที่ และ คือ Centroid ของคลัสเตอร์นั้น
เป้าหมาย: ลดผลรวมระยะทางกำลังสองระหว่างจุดข้อมูล กับ Centroid ของกลุ่มตนเองให้มีค่าน้อยที่สุด
ตัวชี้วัดระยะทางในกระบวนการจัดกลุ่มแบบ -means (Distance Metrics in -means Clustering)
ในการทำงานของ -means clustering การคำนวณระยะทางระหว่างจุดข้อมูลและจุดศูนย์กลาง (centroids) เป็นขั้นตอนสำคัญ เพราะเป็นตัวกำหนดว่าจุดข้อมูลแต่ละจุดจะถูกจัดให้อยู่ในกลุ่มใด
โดยปกติแล้ว -means จะใช้ระยะทางแบบยูคลิด (Euclidean Distance) เป็นค่าเริ่มต้น อย่างไรก็ตาม ยังสามารถใช้ตัวชี้วัดระยะทางประเภทอื่นได้ ขึ้นอยู่กับลักษณะของข้อมูลและบริบทของการวิเคราะห์
1. ระยะทางแบบยูคลิด (Euclidean Distance)
✅ ใช้งานง่ายและเข้าใจได้ไม่ยาก ✅ เหมาะสำหรับข้อมูลเชิงปริมาณ (numerical quantitative data)
❌ มีความไวต่อค่าผิดปกติ (outliers) ❌ ไม่เหมาะเมื่อแต่ละตัวแปรมีสเกลต่างกัน (ควรทำ Standardization ก่อน)
2. ระยะทางแบบแมนฮัตตัน (Manhattan Distance)
✅ เหมาะสำหรับข้อมูลที่มีโครงสร้างแบบตาราง (grid-like structure) เช่น ภาพพิกเซล ✅ มีความไวต่อค่าผิดปกติน้อยกว่าระยะทางแบบยูคลิด
❌ ไม่เหมาะกับข้อมูลที่มีความสัมพันธ์เชิงเส้นหรือรูปแบบทิศทางที่ชัดเจน
3. ความคล้ายคลึงแบบโคไซน์ (Cosine Similarity)
โดยทั่วไป Cosine Similarity ใช้วัด ความคล้ายคลึงกันเชิงมุม (angle-based similarity) ระหว่างเวกเตอร์ แทนที่จะวัดระยะทางระหว่างจุดข้อมูล
✅ เหมาะสำหรับข้อมูลแบบเวกเตอร์ เช่น เอกสาร ข้อความ หรือ embeddings ✅ ไม่ได้รับผลกระทบจากขนาดของเวกเตอร์ (เช่น เอกสารที่มีความยาวต่างกัน)
❌ ไม่เหมาะเมื่อขนาดของเวกเตอร์ (magnitude) มีความสำคัญต่อการจัดกลุ่ม
การคำนวณระยะทางด้วยวิธีต่าง ๆ
ตัวอย่างข้อมูล:
| x | y | |
|---|---|---|
| a | 1 | 2 |
| b | 3 | 4 |
| c | 4 | 3 |
Interactive: Distance
(async () => {
  // =============== Utilities ===============
  const TAU = 2 * Math.PI;

  // "Design size" ของภาพวาด (หน่วย CSS px)
  const W = 680, H = 460;

  // world coords -> (unscaled) canvas coords
  const xlim = [-5, 5], ylim = [-3.5, 3.5];

  // ==== สร้าง DOM ====
  const box = html`<div style="max-width:980px; font:14px system-ui; margin:0 auto;">
    <div id="ctrl" style="display:flex; flex-wrap:wrap; gap:16px; align-items:flex-end; justify-content:center; margin-bottom:10px;"></div>
    <div style="display:flex; justify-content:center;">
      <canvas id="cv" style="border:1px solid #ccc; border-radius:8px; touch-action:none;"></canvas>
    </div>
    <div id="note" style="margin-top:10px; color:#222; line-height:1.35; text-align:center;"></div>
  </div>`;
  const ctrl = box.querySelector("#ctrl");
  const cv   = box.querySelector("#cv");
  const ctx  = cv.getContext("2d");
  const note = box.querySelector("#note");

  // =============== Controls (no grid step) ===============
  const showL2    = Inputs.toggle({label:"Show L2", value:true});
  const showL1    = Inputs.toggle({label:"Show L1", value:true});
  const showLinf  = Inputs.toggle({label:"Show L∞", value:true});
  const showCos   = Inputs.toggle({label:"Show Cosine (CCW only)", value:true});
  ctrl.append(showL2, showL1, showLinf, showCos);

  // =============== DPR & Resize Handling ===============
  function setupCanvasSize() {
    // ขนาด CSS (อาจถูก responsive ปรับได้—เรากำหนดค่าตั้งต้น)
    cv.style.width  = `${W}px`;
    cv.style.height = `${H}px`;

    // ปรับ pixel density ให้คมชัดบน HiDPI
    const dpr = Math.max(1, (window.devicePixelRatio || 1));
    cv.width  = Math.round(W * dpr);
    cv.height = Math.round(H * dpr);

    // scale context ให้วาดด้วยหน่วย "CSS px"
    ctx.setTransform(1,0,0,1,0,0); // reset
    ctx.scale(dpr, dpr);
  }

  setupCanvasSize();
  // ถ้าอยากรองรับการสลับ DPR ตอน zoom OS/Browser:
  window.matchMedia(`(resolution: ${window.devicePixelRatio}dppx)`).addEventListener?.("change", setupCanvasSize);

  // world <-> screen helpers (อิงขนาด "design" W,H)
  const sx0 = W / (xlim[1] - xlim[0]);
  const sy0 = H / (ylim[1] - ylim[0]);
  const toScreenX = x => (x - xlim[0]) * sx0;
  const toScreenY = y => H - (y - ylim[0]) * sy0;
  const toScreen  = p => ({X: toScreenX(p.x), Y: toScreenY(p.y)});

  // พิกัด pointer ต้องชดเชยเมื่อ canvas ถูกย่อ/ขยายด้วย CSS
  function pointerToWorld(evt){
    const r = cv.getBoundingClientRect();
    // สัดส่วน: จากขนาดที่ "เห็นจริง" (rect) -> ระบบพิกัดวาด (W,H)
    const scaleX = W / r.width;
    const scaleY = H / r.height;
    // แปลงพิกัด pointer (ที่เป็น CSS px) -> พิกัดในระบบวาด (W,H)
    const xCanvas = (evt.clientX - r.left) * scaleX;
    const yCanvas = (evt.clientY - r.top)  * scaleY;
    // จาก canvas coords -> world
    const x = xlim[0] + xCanvas / sx0;
    const y = ylim[0] + (H - yCanvas) / sy0;
    return {x, y};
  }

  const dot   = (a,b)=> a.x*b.x + a.y*b.y;
  const norm  = a => Math.hypot(a.x, a.y);
  const clamp = (x,a,b)=> Math.max(a, Math.min(b,x));
  const near  = (a,b,eps=1e-9)=> Math.abs(a-b) <= eps;
  const fmt   = v => Number.isFinite(v) ? v.toFixed(4) : "—";
  const fmtS  = v => Number.isFinite(v) ? v.toFixed(3) : "—";

  // =============== State ===============
  let A = {id:"A", x: -2, y: -1};
  let B = {id:"B", x:  2, y:  1.8};
  let dragging = null;

  // =============== Drawing Helpers ===============
  function drawGrid(){
    const g = 1; // fixed grid
    ctx.save();
    ctx.clearRect(0,0,W,H);

    // bg
    ctx.fillStyle = "#fafafa";
    ctx.fillRect(0,0,W,H);

    // grid
    ctx.lineWidth = 1;
    ctx.strokeStyle = "#eee";
    for(let x = Math.ceil(xlim[0]/g)*g; x <= xlim[1]; x += g){
      const X = toScreenX(x);
      ctx.beginPath(); ctx.moveTo(X, 0); ctx.lineTo(X, H); ctx.stroke();
    }
    for(let y = Math.ceil(ylim[0]/g)*g; y <= ylim[1]; y += g){
      const Y = toScreenY(y);
      ctx.beginPath(); ctx.moveTo(0, Y); ctx.lineTo(W, Y); ctx.stroke();
    }

    // axes
    ctx.strokeStyle = "#999";
    ctx.lineWidth   = 1.5;
    const Y0 = toScreenY(0);
    ctx.beginPath(); ctx.moveTo(0, Y0); ctx.lineTo(W, Y0); ctx.stroke();
    const X0 = toScreenX(0);
    ctx.beginPath(); ctx.moveTo(X0, 0); ctx.lineTo(X0, H); ctx.stroke();

    // ticks & labels
    ctx.fillStyle = "#555";
    ctx.font = "12px system-ui";
    for(let x = Math.ceil(xlim[0]); x <= xlim[1]; x++){
      const X = toScreenX(x);
      ctx.beginPath(); ctx.moveTo(X, Y0-4); ctx.lineTo(X, Y0+4);
      ctx.strokeStyle="#bbb"; ctx.stroke();
      if(!near(x,0)) ctx.fillText(`${x}`, X-4, Y0+14);
    }
    for(let y = Math.ceil(ylim[0]); y <= ylim[1]; y++){
      const Y = toScreenY(y);
      ctx.beginPath(); ctx.moveTo(X0-4, Y); ctx.lineTo(X0+4, Y);
      ctx.strokeStyle="#bbb"; ctx.stroke();
      if(!near(y,0)) ctx.fillText(`${y}`, X0+6, Y+4);
    }
    ctx.restore();
  }

  function drawPoint(P, color="steelblue"){
    const {X,Y} = toScreen(P);
    ctx.beginPath();
    ctx.arc(X,Y,6,0,TAU);
    ctx.fillStyle = color;
    ctx.fill();
    ctx.lineWidth = 2;
    ctx.strokeStyle = "#fff";
    ctx.stroke();

    ctx.fillStyle = "#222";
    ctx.font = "bold 13px system-ui";
    ctx.fillText(P.id, X+10, Y-10);
  }

  function drawSegment(P, Q, style="#666", width=2, dash=null){
    const p = toScreen(P), q = toScreen(Q);
    ctx.save();
    ctx.beginPath();
    if(dash) ctx.setLineDash(dash);
    ctx.moveTo(p.X, p.Y);
    ctx.lineTo(q.X, q.Y);
    ctx.lineWidth = width;
    ctx.strokeStyle = style;
    ctx.stroke();
    ctx.restore();
  }

  // --- CCW minor-arc drawer (always CCW "right→left" ในความหมายเชิงคณิต) ---
  function drawArcCCWMinor(startAngleMath, endAngleMath){
    // CCW delta in [0, 2π)
    let delta = (endAngleMath - startAngleMath + TAU) % TAU;

    // ถ้า delta > π ให้สลับต้น/ปลาย เพื่อให้ได้ "minor arc" ที่ยังเป็น CCW
    let s = startAngleMath, e = endAngleMath;
    if (delta > Math.PI){
      s = endAngleMath;
      e = startAngleMath;
      delta = (e - s + TAU) % TAU; // <= π
    }

    const R = 60;
    const OX = toScreenX(0), OY = toScreenY(0);

    ctx.save();
    ctx.beginPath();
    // แปลงมุมคณิต → canvas (แกน Y ลง): ใช้ค่าลบ และวาด anticlockwise=false
    ctx.arc(OX, OY, R, -s, -e, false);
    ctx.lineWidth = 2;
    ctx.strokeStyle = "#9c27b0";
    ctx.stroke();
    ctx.restore();

    return {thetaMinor: delta, midAngle: s + delta/2};
  }

  // label helper (rounded box)
  function drawLabel(text, X, Y){
    ctx.save();
    ctx.font = "12px system-ui";
    const padX = 6, padY = 4;
    const tw = ctx.measureText(text).width;
    const th = 14;
    const rx = 6;
    const x = X - (tw/2) - padX;
    const y = Y - (th/2) - padY;
    const w = tw + padX*2, h = th + padY*2;

    // rounded rect
    ctx.beginPath();
    ctx.moveTo(x+rx, y);
    ctx.arcTo(x+w, y,   x+w, y+h, rx);
    ctx.arcTo(x+w, y+h, x,   y+h, rx);
    ctx.arcTo(x,   y+h, x,   y,   rx);
    ctx.arcTo(x,   y,   x+w, y,   rx);
    ctx.closePath();
    ctx.fillStyle = "rgba(255,255,255,0.92)";
    ctx.fill();
    ctx.strokeStyle = "rgba(0,0,0,0.15)";
    ctx.stroke();

    ctx.fillStyle = "#111";
    ctx.fillText(text, X - tw/2, Y + 4);
    ctx.restore();
  }

  // =============== Metric Drawers (with labels) ===============
  function drawL2(A,B,dx,dy){
    const L2 = Math.hypot(dx,dy);
    drawSegment(A, B, "#1976d2", 3);
    const Ax_By = {x:B.x, y:A.y};
    drawSegment(A, Ax_By, "#1976d2", 1.5, [6,6]);
    drawSegment(Ax_By, B, "#1976d2", 1.5, [6,6]);
    const mid = toScreen({x:(A.x+B.x)/2, y:(A.y+B.y)/2});
    drawLabel(`L2 = ${fmt(L2)}`, mid.X, mid.Y - 12);
  }

  function drawL1(A,B,dx,dy){
    const L1 = Math.abs(dx) + Math.abs(dy);
    const Ax_By = {x:B.x, y:A.y};
    drawSegment(A, Ax_By, "#f57c00", 3);
    drawSegment(Ax_By, B, "#f57c00", 3);
    // legs
    const leg1mid = toScreen({x:(A.x+Ax_By.x)/2, y:(A.y+Ax_By.y)/2});
    const leg2mid = toScreen({x:(Ax_By.x+B.x)/2, y:(Ax_By.y+B.y)/2});
    drawLabel(`|dx|=${fmtS(Math.abs(dx))}`, leg1mid.X, leg1mid.Y - 14);
    drawLabel(`|dy|=${fmtS(Math.abs(dy))}`, leg2mid.X, leg2mid.Y - 14);
    const mid = toScreen({x:(A.x+B.x)/2, y:(A.y+B.y)/2});
    drawLabel(`L1 = ${fmt(L1)}`, mid.X, mid.Y + 16);
  }

  function drawLinf(A,B,dx,dy){
    const Linf = Math.max(Math.abs(dx), Math.abs(dy));
    const xmin = Math.min(A.x, B.x), xmax = Math.max(A.x, B.x);
    const ymin = Math.min(A.y, B.y), ymax = Math.max(A.y, B.y);
    // rectangle
    ctx.save();
    ctx.beginPath();
    [{x:xmin,y:ymin},{x:xmax,y:ymin},{x:xmax,y:ymax},{x:xmin,y:ymax},{x:xmin,y:ymin}]
      .forEach((p,i)=>{ const {X,Y}=toScreen(p); if(i===0) ctx.moveTo(X,Y); else ctx.lineTo(X,Y); });
    ctx.lineWidth = 2; ctx.strokeStyle = "#2e7d32"; ctx.stroke(); ctx.restore();

    if(Math.abs(dx) >= Math.abs(dy)){
      drawSegment({x:xmin,y:ymin},{x:xmax,y:ymin},"#2e7d32",4);
      drawSegment({x:xmin,y:ymax},{x:xmax,y:ymax},"#2e7d32",4);
      const P = toScreen({x:xmin,y:ymin}), Q = toScreen({x:xmax,y:ymin});
      drawLabel(`L∞ = ${fmt(Linf)}`, (P.X+Q.X)/2, (P.Y+Q.Y)/2 - 12);
    } else {
      drawSegment({x:xmin,y:ymin},{x:xmin,y:ymax},"#2e7d32",4);
      drawSegment({x:xmax,y:ymin},{x:xmax,y:ymax},"#2e7d32",4);
      const P = toScreen({x:xmin,y:ymin}), Q = toScreen({x:xmin,y:ymax});
      drawLabel(`L∞ = ${fmt(Linf)}`, (P.X+Q.X)/2 - 12, (P.Y+Q.Y)/2);
    }
  }

  function drawCos(A,B){
    const O = {x:0, y:0};
    drawSegment(O, A, "#6a1b9a", 3);
    drawSegment(O, B, "#6a1b9a", 3);

    const aN = norm(A), bN = norm(B);
    if(!(aN>0 && bN>0)){
      const OX = toScreenX(0), OY = toScreenY(0);
      drawLabel(`cosine: ‖A‖= ${fmtS(aN)}, ‖B‖= ${fmtS(bN)} ⇒ undefined`, OX+90, OY-40);
      return;
    }
    const cosT   = clamp(dot(A,B)/(aN*bN), -1, 1);
    const cosDst = 1 - cosT;

    // คำนวณมุมคณิต
    const angA = Math.atan2(A.y, A.x);
    const angB = Math.atan2(B.y, B.x);

    // วาด "minor CCW arc" เสมอ
    const {thetaMinor, midAngle} = drawArcCCWMinor(angA, angB);

    // ป้ายกำกับ
    const theta = Math.min(thetaMinor, Math.PI);
    const deg = (theta * 180 / Math.PI).toFixed(1);
    const R = 70;
    const X = toScreenX(R * Math.cos(midAngle));
    const Y = toScreenY(R * Math.sin(midAngle));
    drawLabel(`θ≈${deg}°, 1−cosθ≈${fmt(cosDst)}`, X, Y);
  }

  // =============== Compose & Numbers ===============
  function render(){
    drawGrid();
    drawPoint(A, "#1565c0");
    drawPoint(B, "#ef6c00");

    const dx = B.x - A.x, dy = B.y - A.y;

    if(showL2.value)   drawL2(A,B,dx,dy);
    if(showL1.value)   drawL1(A,B,dx,dy);
    if(showLinf.value) drawLinf(A,B,dx,dy);
    if(showCos.value)  drawCos(A,B);

    // summary
    const L2   = Math.hypot(dx, dy);
    const L1   = Math.abs(dx) + Math.abs(dy);
    const Linf = Math.max(Math.abs(dx), Math.abs(dy));
    const aN = norm(A), bN = norm(B);
    const cosSim = (aN>0 && bN>0) ? clamp(dot(A,B)/(aN*bN), -1, 1) : NaN;
    const cosDist = Number.isFinite(cosSim) ? (1 - cosSim) : NaN;
    note.innerHTML = `
      <b>A</b> = (${fmt(A.x)}, ${fmt(A.y)}), <b>B</b> = (${fmt(B.x)}, ${fmt(B.y)}) ·
      Δ = (${fmt(dx)}, ${fmt(dy)}) ·
      <b>L2</b> ${fmt(L2)} · <b>L1</b> ${fmt(L1)} · <b>L∞</b> ${fmt(Linf)} · <b>Cos</b> ${fmt(cosDist)}
    `;
  }

  // =============== Pointer Dragging (robust to scaling) ===============
  function pickPoint(world){
    const hitR = 0.25;
    const hit = P => Math.hypot(P.x - world.x, P.y - world.y) < hitR;
    if(hit(A)) return "A";
    if(hit(B)) return "B";
    return null;
  }

  function clampWorld(p){
    return {
      x: Math.max(xlim[0], Math.min(xlim[1], p.x)),
      y: Math.max(ylim[0], Math.min(ylim[1], p.y)),
    };
  }

  function onPointerDown(e){
    e.preventDefault();
    const w = pointerToWorld(e);
    dragging = pickPoint(w);
    if(dragging){
      cv.setPointerCapture?.(e.pointerId);
    }
  }
  function onPointerMove(e){
    if(!dragging) return;
    e.preventDefault();
    const w = clampWorld(pointerToWorld(e));
    if(dragging === "A"){ A = {...A, ...w}; }
    else if(dragging === "B"){ B = {...B, ...w}; }
    render();
  }
  function onPointerUp(e){
    if(dragging){
      cv.releasePointerCapture?.(e.pointerId);
    }
    dragging = null;
  }

  cv.addEventListener("pointerdown", onPointerDown, {passive:false});
  cv.addEventListener("pointermove", onPointerMove, {passive:false});
  cv.addEventListener("pointerup",   onPointerUp,   {passive:false});
  cv.addEventListener("pointercancel", onPointerUp, {passive:false});

  [showL2, showL1, showLinf, showCos].forEach(el => el.addEventListener("input", render));

  // initial draw
  render();
  return box;
})()
ตัวอย่างของ -means
1. ชุดข้อมูลตัวอย่าง
เรามีข้อมูล 5 จุดในมิติ 2 ตัวแปร (X, Y) และต้องการแบ่งออกเป็น คลัสเตอร์
| Data Point | X | Y |
|---|---|---|
| A | 2 | 10 |
| B | 2 | 5 |
| C | 8 | 4 |
| D | 5 | 8 |
| E | 7 | 5 |

2. ขั้นตอนการคำนวณของ -means
(1) กำหนดค่า และสุ่มเลือกจุดศูนย์กลางเริ่มต้น (initial centroids)
กำหนดจำนวนกลุ่ม:
สุ่มเลือกจุดศูนย์กลางเริ่มต้น (สมมติเลือก A และ C)
- Centroid 1 (C1) = A = (2, 10)
- Centroid 2 (C2) = C = (8, 4)
(2) คำนวณระยะทางจากแต่ละจุดไปยังจุดศูนย์กลาง
โดยใช้ ระยะทางแบบยูคลิด (Euclidean Distance):
| Data Point | Nearest Cluster | ||
|---|---|---|---|
| A (2,10) | 0.00 | 8.49 | C1 |
| B (2,5) | 5.00 | 6.08 | C1 |
| C (8,4) | 8.49 | 0.00 | C2 |
| D (5,8) | 3.61 | 5.00 | C1 |
| E (7,5) | 7.07 | 1.41 | C2 |
First-round result:
- C1 cluster: {A, B, D}, C2 cluster: {C, E}

(3) Compute new centroids for each cluster
Centroid 1 (C1) {A, B, D}
Centroid 2 (C2) {C, E}
(4) ทำซ้ำขั้นตอนที่ 2 และ 3
คำนวณระยะทางใหม่และจัดจุดข้อมูลให้อยู่ในคลัสเตอร์ที่เหมาะสมอีกครั้ง
อัปเดตค่าจุดศูนย์กลาง (centroid) และทำซ้ำขั้นตอนนี้ไปเรื่อย ๆ จนกว่าค่าจุดศูนย์กลางจะไม่เปลี่ยนแปลงอีก (ถือว่าเข้าสู่ภาวะคงที่ หรือ convergence)
3. Compute -means

Animation of K-means
triIcon = (color, size = 16) => {
  const ns = "http://www.w3.org/2000/svg";
  const svg = document.createElementNS(ns, "svg");
  svg.setAttribute("width", size);
  svg.setAttribute("height", size);
  svg.setAttribute("viewBox", "0 0 20 20");
  svg.style.verticalAlign = "-2px";  // จัดให้อยู่ระดับเดียวกับตัวอักษร

  const poly = document.createElementNS(ns, "polygon");
  poly.setAttribute("points", "10,2 18,18 2,18");  // ▲
  poly.setAttribute("fill", color);
  poly.setAttribute("stroke", "black");
  poly.setAttribute("stroke-width", "1.5");

  svg.appendChild(poly);
  return svg;
};

// ต่อไอคอน + ข้อความเป็น label เดียว
triLabel = (color, text) => {
  const span = document.createElement("span");
  span.style.display = "inline-flex";
  span.style.alignItems = "center";
  span.style.gap = ".4rem";
  span.append(triIcon(color, 16), document.createTextNode(text));
  return span;
};

// สีประจำคลัสเตอร์ (ปรับได้)
C1_COLOR = "#f4b400";  // เหลืองทอง
C2_COLOR = "#1a73e8";  // น้ำเงิน
C3_COLOR = "#ea4335";
Set up
viewof km_c1x = Inputs.range([-2, 9], {step: 1, value:  2, label: triLabel(C2_COLOR, "C1: x")})
viewof km_c1y = Inputs.range([-2, 7], {step: 1, value:  1, label: triLabel(C2_COLOR, "C1: y")})

viewof km_c2x = Inputs.range([-2, 9], {step: 1, value:  1, label: triLabel(C1_COLOR, "C2: x")})
viewof km_c2y = Inputs.range([-2, 7], {step: 1, value:  4, label: triLabel(C1_COLOR, "C2: y")})

viewof km_c3x = Inputs.range([-2, 9], {step: 1, value:  6, label: triLabel(C3_COLOR, "C3: x")})
viewof km_c3y = Inputs.range([-2, 7], {step: 1, value:  2, label: triLabel(C3_COLOR, "C3: y")})


viewof km_clicks = Inputs.button("Randomize Data")
viewof km_reset  = Inputs.button("Reset (frame → 0)")
viewof km_point_r = Inputs.range([4, 14], { step: 1, value: 8, label: "Point size (data)" })
xmur3 = (str) => { let h=1779033703^str.length;
for (let i=0;i<str.length;i++) h=Math.imul(h^str.charCodeAt(i),3432918353), h=h<<13|h>>>19;
return ()=>{ h=Math.imul(h^h>>>16,2246822507); h=Math.imul(h^h>>>13,3266489909); return (h^h>>>16)>>>0; };
}
mulberry32 = (a) => () => { let t=a+=0x6D2B79F5; t=Math.imul(t^t>>>15,t|1); t^=t+Math.imul(t^t>>>7,t|61); return ((t^t>>>14)>>>0)/4294967296; }
// ===== Data (3 กลุ่ม) =====
km_makeData = (n=60, seed=1) => {
const rand = mulberry32(xmur3(String(seed))());
const jitter = (s)=> (rand()*2-1)*s;
const blob = (cx,cy,s,n) => Array.from({length:n},()=>({x:cx+jitter(s), y:cy+jitter(s)}));
const sigma = 1.25;
return [
...blob(0, 0, sigma, n),
...blob(3.5, 3.5, sigma, n),
...blob(7, 0, sigma, n)
];
}
km_data = km_makeData(60, km_clicks) // กดปุ่มแล้วสุ่มใหม่
// ===== K-means (อัปเดตเต็มแบบมาตรฐาน) =====
km_nearest = (p, centers) => {
let best=0, bestd=Infinity;
for (let i=0;i<centers.length;i++){
const dx=p.x-centers[i].x, dy=p.y-centers[i].y, d=dx*dx+dy*dy;
if (d<bestd){bestd=d; best=i;}
}
return best;
}
km_step = (points, centers) => {
const k = centers.length;
const groups = Array.from({length:k}, ()=>[]);
for (const p of points) groups[km_nearest(p,centers)].push(p);
const next = centers.map((c,i)=>{
const g=groups[i];
if (g.length===0) return {...c};
const mx=g.reduce((s,p)=>s+p.x,0)/g.length;
const my=g.reduce((s,p)=>s+p.y,0)/g.length;
return {x:mx, y:my};
});
return {groups, centers: next};
}
// ===== History (รวมเฟรม 0 = จุดตั้งต้นตามสไลเดอร์) =====
KM_MAX_ITER = 15
km_initCenters = [{x:km_c1x,y:km_c1y},{x:km_c2x,y:km_c2y},{x:km_c3x,y:km_c3y}]
km_history = (() => {
let centers = km_initCenters.map(d=>({...d}));
const hist = [];
// frame 0: assign ด้วยศูนย์เริ่มต้น (ตรงสไลเดอร์)
const initGroups = Array.from({length: centers.length}, ()=>[]);
for (const p of km_data) initGroups[km_nearest(p, centers)].push(p);
hist.push({iter: 0, groups: initGroups, centers: centers.map(d=>({...d}))});
// frame 1..N
for (let iter=1; iter<=KM_MAX_ITER; iter++){
const {groups, centers: next} = km_step(km_data, centers);
hist.push({iter, groups, centers: next});
const conv = next.every((c,i)=> Math.hypot(c.x-centers[i].x,c.y-centers[i].y) < 1e-6);
centers = next;
if (conv){
for (let extra=iter+1; extra<=KM_MAX_ITER; extra++) hist.push(hist[hist.length-1]);
break;
}
}
return hist;
})()
// ===== Frame + Progress (ไม่มี autoplay) =====
viewof km_frame = Inputs.range([0, KM_MAX_ITER], { value: 0, step: 1, label: "Iteration (0 = initial)" })
{
const el = document.createElement("div");
el.style.display = "flex"; el.style.alignItems = "center"; el.style.gap = ".5rem";
const pr = document.createElement("progress"); pr.max = KM_MAX_ITER; pr.value = km_frame; pr.style.width = "220px";
const span = document.createElement("span"); span.textContent = `${km_frame} / ${KM_MAX_ITER}`;
el.append(pr, span);
return el;
}{
// list dependency เพื่อให้ cell นี้ re-run เมื่อค่าใดค่าหนึ่งเปลี่ยน
const _triggers = [km_reset, km_clicks, km_c1x, km_c1y, km_c2x, km_c2y, km_c3x, km_c3y];
if (viewof km_frame) {
// ตั้งค่าเฟรมกลับ 0
viewof km_frame.value = 0;
// 🔔 บังคับแจ้งเตือนระบบรีแอคทีฟ (สำคัญมาก)
viewof km_frame.dispatchEvent(new InputEvent("input", { bubbles: true }));
}
null // ไม่ให้แสดงค่า 'undefined' บนหน้าจอ
}{
const state0 = km_history[km_frame];
const { groups, centers } = state0;
const colored = [];
groups.forEach((g, i) => g.forEach(p => colored.push({ ...p, cluster: `C${i + 1}` })));
const cpts = centers.map((c, i) => ({ ...c, cluster: `C${i + 1}` }));
// เส้นทาง centroid จากเฟรม 0 → เฟรมปัจจุบัน (tracks)
const tracks = [];
centers.forEach((_, i) => {
for (let t = 0; t <= km_frame; t++) {
const c = km_history[t].centers[i];
tracks.push({ x: c.x, y: c.y, cluster: `C${i + 1}`, t });
}
});
const W = width, H = Math.round(W * 0.65);
// โหลด Plot
const P = await import("https://cdn.jsdelivr.net/npm/@observablehq/plot@0.6/+esm");
return P.plot({
width: W, height: H,
grid: true, nice: false,
x: { label: "X", domain: [-2, 9] },
y: { label: "Y", domain: [-2, 7] },
marks: [
// จุดข้อมูล: (ถ้าอยากใหญ่ขึ้นก็เพิ่ม r)
P.dot(colored, { x: "x", y: "y", r: km_point_r, fill: "cluster", opacity: 0.85, tip: true }),
// เส้นทาง centroid
P.line(tracks, { x: "x", y: "y", stroke: "cluster" }),
// ✅ centroid เป็น “สามเหลี่ยม” และใหญ่ขึ้น
P.dot(cpts, {
x: "x", y: "y",
r: 14, // ขนาดใหญ่ขึ้น (ปรับได้)
symbol: "triangle", // เปลี่ยนเป็นสามเหลี่ยม
stroke: "black",
strokeWidth: 1.5,
fill: "cluster"
// ถ้าอยากหันปลายขึ้น-ลง: เพิ่ม rotate: 0 (ขึ้น), 180 (ลง) ได้
})
]
});
}K-mean (3D)
viewof mode3d = Inputs.radio(["Uniform","Gaussian"], {label: "Data mode (3D)", value: "Gaussian"})
viewof n_uniform3d = Inputs.range([100, 1500], {label: "Number of points (Uniform)", value: 600, step: 50})

viewof ktrue3d = Inputs.range([2, 8], {label: "True clusters (Gaussian)", value: 4, step: 1})
viewof nper3d  = Inputs.range([30, 400], {label: "Points per cluster", value: 120, step: 10})
viewof spread3d = Inputs.range([0.1, 1.5], {label: "Cluster spread (sd)", value: 0.45, step: 0.05})

viewof k3d = Inputs.range([2, 8], {label: "k-means clusters (k)", value: 4, step: 1})
viewof seed3d = Inputs.number({label: "Seed", value: 123, step: 1, min: 0})
viewof rerun3d = Inputs.button({label: "Re-run dataset (3D)"})
function mulberry32_3d(a){return function(){let t=a+=0x6D2B79F5;t=Math.imul(t^t>>>15,t|1);t^=t+Math.imul(t^t>>>7,t|61);return((t^t>>>14)>>>0)/4294967296;};}
function randn3d(rng){ const u=1-rng(), v=1-rng(); return Math.sqrt(-2*Math.log(u))*Math.cos(2*Math.PI*v); }
function L2sq3d(a,b){ return (a.x-b.x)**2 + (a.y-b.y)**2 + (a.z-b.z)**2; }// ===== Generate 3D data =====
data3d = {
rerun3d; // regenerate when button clicked
const rng = mulberry32_3d(seed3d);
if (mode3d === "Uniform") {
const n = n_uniform3d;
return Array.from({length:n}, () => ({
x: 10*rng(), y: 10*rng(), z: 10*rng()
}));
} else { // Gaussian clusters
const K = ktrue3d, sd = spread3d, per = nper3d;
const centers = Array.from({length:K}, () => ({
cx: 1.5 + 7*rng(), cy: 1.5 + 7*rng(), cz: 1.5 + 7*rng()
}));
const pts = [];
for (const c of centers){
for (let i=0;i<per;i++){
pts.push({
x: c.cx + sd*randn3d(rng),
y: c.cy + sd*randn3d(rng),
z: c.cz + sd*randn3d(rng)
});
}
}
return pts;
}
}function kmeans3d(points, k, maxIter=30) {
let centroids = points.slice().sort(()=>0.5-Math.random()).slice(0,k).map(p=>({x:p.x,y:p.y,z:p.z}));
for (let it=0; it<maxIter; it++){
points.forEach(p=>{
let best=0, bd=Infinity;
for (let i=0;i<centroids.length;i++){
const d = L2sq3d(p, centroids[i]);
if (d<bd){ bd=d; best=i; }
}
p.cid3d = best;
});
centroids = Array.from({length:k}, (_,i)=>{
const S = points.filter(p=>p.cid3d===i);
const mx = d3.mean(S,d=>d.x), my = d3.mean(S,d=>d.y), mz = d3.mean(S,d=>d.z);
return {
x: Number.isFinite(mx)?mx:Math.random()*10,
y: Number.isFinite(my)?my:Math.random()*10,
z: Number.isFinite(mz)?mz:Math.random()*10
};
});
}
return {points, centroids};
}
result3d = kmeans3d([...data3d], k3d)viewof layout3d = {
const container = html`<div style="max-width:1080px; font:14px system-ui;">
<!-- controls: 3-row grid -->
<div id="ctrl" style="
display:grid;
grid-template-columns: repeat(3, minmax(200px, 1fr));
gap: 12px;
margin-bottom: 12px;
"></div>
<div id="plot"></div>
</div>`;
const ctrl = container.querySelector("#ctrl");
const plotDiv = container.querySelector("#plot");
// เอา inputs มาไว้บนสุด (กระจายเป็น 3 แถวใน grid)
ctrl.append(
viewof mode3d,
viewof n_uniform3d,
viewof ktrue3d,
viewof nper3d,
viewof spread3d,
viewof k3d,
viewof seed3d,
viewof rerun3d
);
// plot area
const plotArea = html`<div style="width:100%; height:520px;"></div>`;
plotDiv.append(plotArea);
// traces
const groups = d3.group(result3d.points, d => d.cid3d);
const palette = d3.schemeTableau10;
const pointTraces = Array.from(groups, ([cid, arr]) => ({
name: `Cluster ${cid+1}`,
type: "scatter3d",
mode: "markers",
x: arr.map(d=>d.x), y: arr.map(d=>d.y), z: arr.map(d=>d.z),
marker: { size: 3, color: palette[cid % palette.length] }
}));
const cents = result3d.centroids.map((c,i)=>({...c, cid:i}));
const centroidTrace = {
name: "Centroids",
type: "scatter3d",
mode: "markers+text",
x: cents.map(d=>d.x), y: cents.map(d=>d.y), z: cents.map(d=>d.z),
marker: { size: 7, color: cents.map(d=>palette[d.cid % palette.length]), line:{color:"black", width:1} },
text: cents.map((_,i)=>String(i+1)),
textposition: "top center"
};
const layout = {
margin: {l:0, r:0, t:0, b:0},
scene: {aspectmode: "cube", xaxis:{title:"X"}, yaxis:{title:"Y"}, zaxis:{title:"Z"}},
legend: {orientation: "h"}
};
Plotly3d.newPlot(plotArea, [...pointTraces, centroidTrace], layout, {responsive:true});
return container;
}การเลือกจำนวนคลัสเตอร์ที่เหมาะสมใน -means ด้วยค่า Silhouette Score
การเลือกจำนวนคลัสเตอร์ ที่เหมาะสมในอัลกอริทึม -means เป็นสิ่งสำคัญ เพราะหากเลือก ที่น้อยหรือมากเกินไป อาจทำให้ผลการจัดกลุ่มไม่มีประสิทธิภาพ
Silhouette Score เป็น ตัวชี้วัดคุณภาพของการจัดกลุ่ม (clustering quality metric) โดยพิจารณาจากสององค์ประกอบหลักคือ:
- : ระยะทางเฉลี่ยระหว่างจุดข้อมูลหนึ่งกับจุดอื่น ๆ ในคลัสเตอร์เดียวกัน → แทนความ “แน่นของกลุ่ม” (cluster cohesion)
- : ระยะทางเฉลี่ยระหว่างจุดข้อมูลหนึ่งกับจุดในคลัสเตอร์ที่ใกล้ที่สุด → แทนความ “แยกของกลุ่ม” (cluster separation)
เมื่อ ใกล้ 1 → จุดข้อมูลนั้นถูกจัดอยู่ในกลุ่มที่เหมาะสมและมีความสอดคล้องกับคลัสเตอร์ของตนเองดี
เมื่อ ใกล้ 0 → จุดข้อมูลนั้นอยู่ใกล้ขอบเขตระหว่างคลัสเตอร์ อาจอยู่ระหว่างสองกลุ่ม
เมื่อ ใกล้ -1 → จุดข้อมูลนั้นมีแนวโน้มว่าจะถูกจัดให้อยู่ในคลัสเตอร์ที่ไม่ถูกต้อง
วิธีใช้ค่า Silhouette Score เพื่อเลือกจำนวนคลัสเตอร์
ค่าเฉลี่ยของ Silhouette Score แสดงถึงความเหมาะสมของจำนวนคลัสเตอร์ ที่เลือกใช้
รันอัลกอริทึม -means โดยใช้ค่าของ หลายค่า (เช่น )
คำนวณค่า Silhouette Score สำหรับแต่ละค่า
เลือกค่าของ ที่ให้ ค่าเฉลี่ยของ Silhouette Score สูงที่สุด
Interpreting Silhouette Values by Cluster
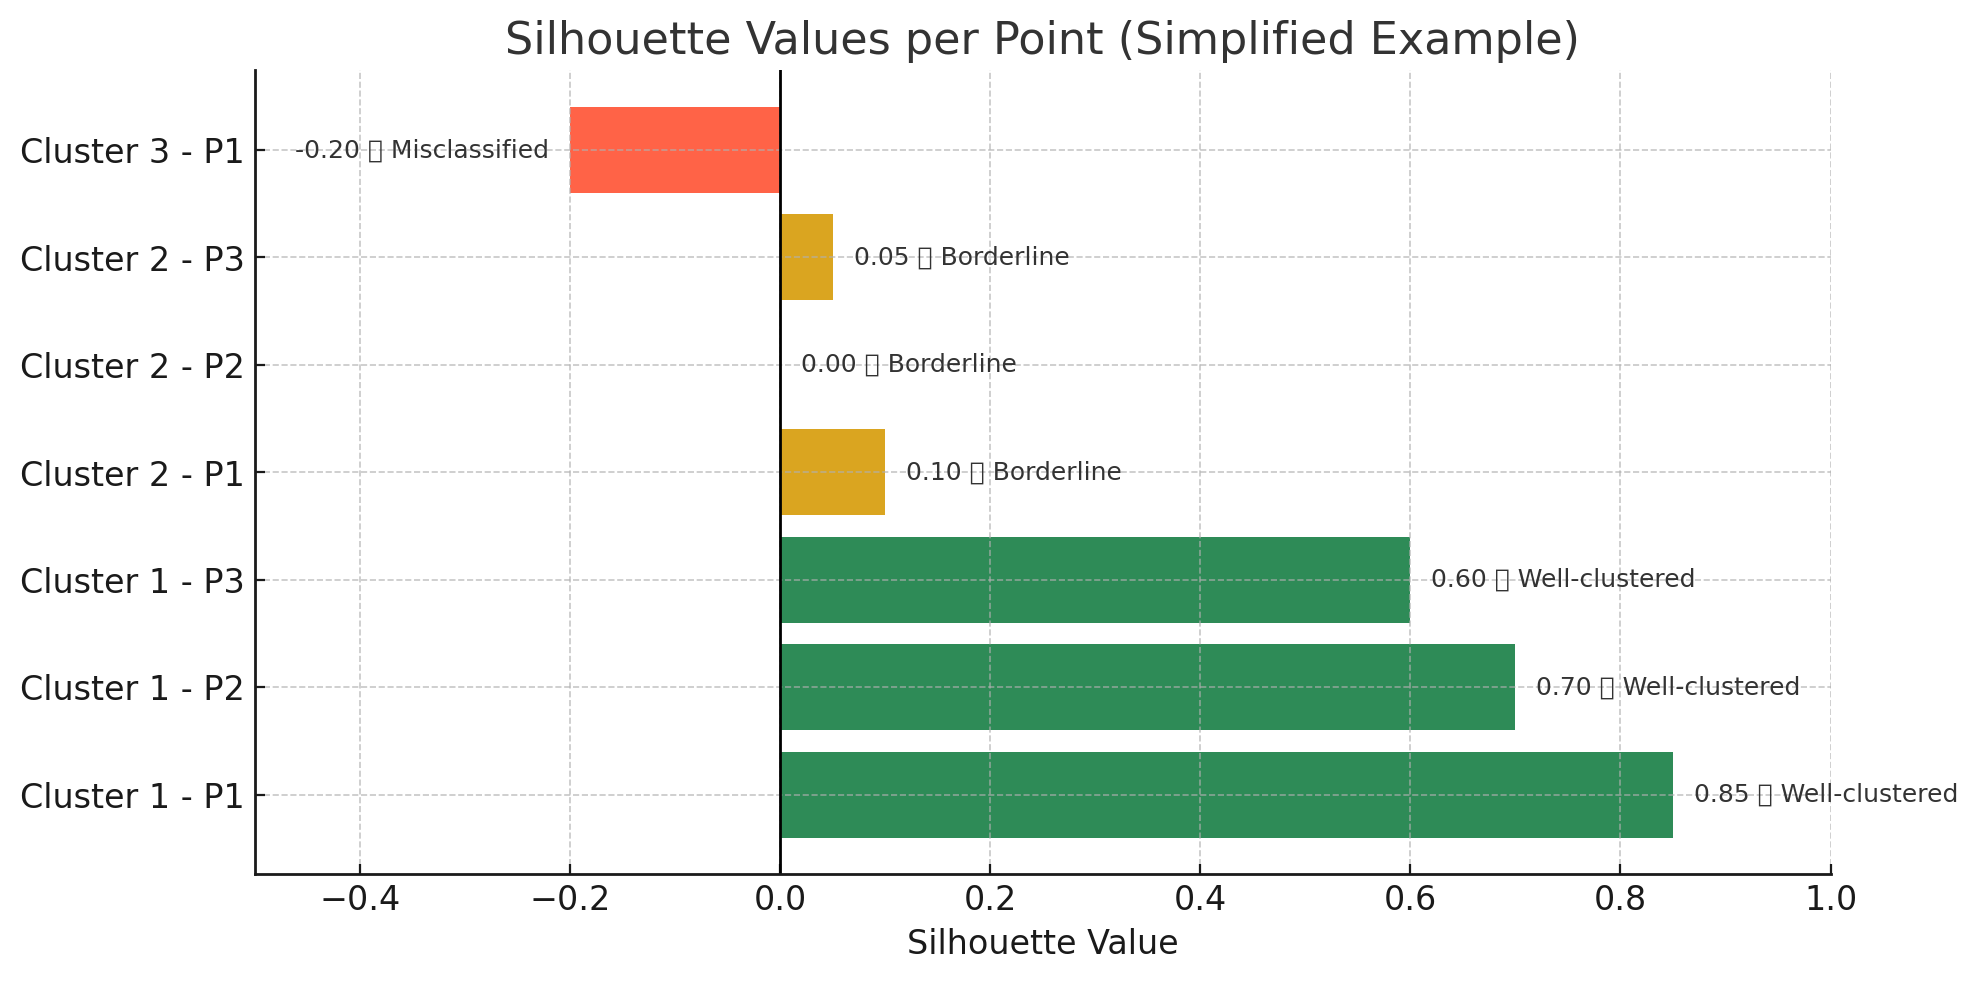
คลัสเตอร์ที่ 1 (จัดกลุ่มได้ดี): จุดข้อมูลทั้งสามมีค่า Silhouette เป็นบวกสูง (0.60–0.85) แสดงว่าจุดเหล่านี้อยู่รวมกันแน่นในกลุ่มของตนเอง และแยกออกจากคลัสเตอร์อื่นได้ชัดเจน
คลัสเตอร์ที่ 2 (อยู่ใกล้ขอบเขต): จุดข้อมูลหนึ่งมีค่า Silhouette เท่ากับ 0 และจุดอื่น ๆ มีค่าใกล้ศูนย์ (0.05–0.10) แสดงว่าจุดเหล่านี้อยู่ใกล้เส้นแบ่งระหว่างคลัสเตอร์ การจัดกลุ่มจึงอาจไม่ชัดเจน
คลัสเตอร์ที่ 3 (จัดกลุ่มได้ไม่ดี): จุดข้อมูลเพียงจุดเดียวมีค่า Silhouette เป็นลบ (-0.20) หมายความว่าจุดนั้นอยู่ใกล้คลัสเตอร์อื่นมากกว่าคลัสเตอร์ของตนเอง ซึ่งบ่งชี้ถึงความเป็นไปได้ของการจัดกลุ่มที่ไม่ถูกต้อง
Interactive K-means & Silhouette Score
(async () => {
  // ====== UI skeleton ======
  const box = html`<div style="max-width:1200px;font:14px system-ui;">
    <div id="ctrl" style="display:grid;grid-template-columns:repeat(2,minmax(0,1fr));gap:10px;margin-bottom:10px;"></div>

    <!-- Side-by-side row: scatter (wider) | table (narrower) -->
    <div id="viz" style="
      display:grid;
      grid-template-columns:8fr 2fr;   /* ~80/20 */
      gap:12px;
      align-items:start;
      min-height:680px;
    ">
      <div id="plot" style="width:100%; overflow-x:auto;"></div>
      <div id="dash" style="width:100%; overflow:auto;"></div>
    </div>

    <div id="note" style="margin-top:6px;color:#444"></div>
  </div>`;
  const ctrl    = box.querySelector("#ctrl");
  const viz     = box.querySelector("#viz");
  const plotDiv = box.querySelector("#plot");
  const dash    = box.querySelector("#dash");
  const note    = box.querySelector("#note");

  // ====== Controls ======
  const seedS     = Inputs.range([1,9999],  {value: 1234, step: 1,    label: "Seed"});
  const trueKS    = Inputs.range([2,5],     {value: 3,    step: 1,    label: "True clusters (for data)"});
  const nPerS     = Inputs.range([20,300],  {value: 80,   step: 10,   label: "Points per cluster"});
  const spreadS   = Inputs.range([0.2,2.0], {value: 0.7,  step: 0.1,  label: "Spread (σ)"});
  const kS        = Inputs.range([2,10],    {value: 3,    step: 1,    label: "k (K-means)"});
  const btnRes    = Inputs.button("Resample");

  const left  = html`<div></div>`;
  const right = html`<div></div>`;
  left.append(seedS, trueKS, nPerS);
  right.append(spreadS, kS, btnRes);
  ctrl.append(left, right);

  // ====== Utils ======
  function mulberry32(a){ return function(){ let t=a+=0x6D2B79F5; t=Math.imul(t^t>>>15,t|1); t^=t+Math.imul(t^t>>>7,t|61); return ((t^t>>>14)>>>0)/4294967296 } }
  function rnorm(rng, m=0, s=1){ let u=0,v=0; while(u===0) u=rng(); while(v===0) v=rng(); return m + s*Math.sqrt(-2*Math.log(u))*Math.cos(2*Math.PI*v); }
  function dist(a,b){ return Math.hypot(a.x-b.x, a.y-b.y); }
  function dist2(a,b){ const dx=a.x-b.x, dy=a.y-b.y; return dx*dx+dy*dy; }
  const clamp = (x,a,b)=> Math.max(a, Math.min(b,x));
  const palette = k => ["#1f77b4","#ff7f0e","#2ca02c","#d62728","#9467bd","#8c564b","#e377c2","#7f7f7f","#bcbd22","#17becf"].slice(0,k);

  // ====== Nonce for Resample ======
  let resampleNonce = 0; // จะเพิ่มทุกครั้งที่กดปุ่ม Resample

  // ====== Data generator ======
  function genData(trueK, nPer, spread, seed, nonce){
    const mixedSeed = (seed|0) ^ (nonce * 0x9e3779b9); // golden-ratio mix
    const rng = mulberry32(9000 + mixedSeed);
    const centers = Array.from({length:trueK}, (_,i)=>({
      x: (i+1)/(trueK+1) + 0.1*rnorm(rng,0,0.2),
      y: 0.35 + 0.25*Math.sin(i*1.7) + 0.1*rnorm(rng,0,0.2)
    })).map(c => ({x: clamp(c.x,0.1,0.9), y: clamp(c.y,0.1,0.9)}));

    const pts = [];
    for (let k=0;k<trueK;k++){
      for (let n=0;n<nPer;n++){
        pts.push({
          x: clamp(rnorm(rng, centers[k].x, spread*0.12), 0, 1),
          y: clamp(rnorm(rng, centers[k].y, spread*0.12), 0, 1)
        });
      }
    }
    return pts;
  }

  // ====== K-means (k-means++ init) ======
  function kmeansPPInit(points, k, rng){
    const n = points.length;
    const centers = [];
    centers.push(points[(rng()*n)|0]);
    const d2 = new Array(n).fill(0);
    while(centers.length < k){
      for(let i=0;i<n;i++){
        let best = Infinity;
        for(const c of centers){
          const vv = dist2(points[i], c);
          if(vv<best) best = vv;
        }
        d2[i] = best;
      }
      const sum = d2.reduce((s,x)=>s+x,0) || 1e-12;
      let r = rng()*sum, pick = 0;
      for(let i=0;i<n;i++){ r -= d2[i]; if(r<=0){ pick=i; break; } }
      centers.push({x: points[pick].x, y: points[pick].y});
    }
    return centers;
  }
  function kmeans(points, k, maxIters, seed, nonce){
    // ใช้ nonce ผสมเข้า seed ของ K-means ด้วย เพื่อให้ path เปลี่ยนแน่
    const rng = mulberry32(5000 + ((seed|0) ^ (nonce * 0x517cc1)) + k*31);
    k = Math.max(1, Math.min(k, points.length));
    let centers = kmeansPPInit(points, k, rng).map(c => ({x:c.x, y:c.y}));
    let labels  = new Array(points.length).fill(0);

    for(let iter=0; iter<maxIters; iter++){
      let changed = false;
      for(let i=0;i<points.length;i++){
        let best=-1, bestd=Infinity;
        for(let c=0;c<k;c++){
          const d = dist2(points[i], centers[c]);
          if(d < bestd){ bestd=d; best=c; }
        }
        if(labels[i] !== best){ labels[i]=best; changed = true; }
      }
      const sum = Array.from({length:k}, _ => ({x:0,y:0,c:0}));
      for(let i=0;i<points.length;i++){ const c=labels[i]; sum[c].x += points[i].x; sum[c].y += points[i].y; sum[c].c++; }
      for(let c=0;c<k;c++){
        if(sum[c].c>0){
          centers[c].x = sum[c].x / sum[c].c;
          centers[c].y = sum[c].y / sum[c].c;
        }
      }
      if(!changed) break;
    }
    const labeled = points.map((p,i)=> ({...p, cid: labels[i]}));
    return {labeled, centers};
  }

  // ====== Silhouette (mean) ======
  function silhouette(points, labels, k){
    const groups = Array.from({length:k}, ()=>[]);
    for (let i=0;i<labels.length;i++) groups[labels[i]].push(i);

    const D = new Array(points.length);
    for (let i=0;i<points.length;i++){
      D[i] = new Array(points.length);
      for (let j=0;j<points.length;j++){
        D[i][j] = i===j? 0 : dist(points[i], points[j]);
      }
    }

    const s = new Array(points.length).fill(0);
    for (let i=0;i<points.length;i++){
      const ci = labels[i];
      const same = groups[ci];
      let a = 0;
      if (same.length>1){
        for (const j of same) if (j!==i) a += D[i][j];
        a /= (same.length-1);
      } else a = 0;
      let b = Infinity;
      for (let c=0;c<k;c++){
        if (c===ci || groups[c].length===0) continue;
        let avg=0;
        for (const j of groups[c]) avg += D[i][j];
        avg /= groups[c].length;
        if (avg<b) b=avg;
      }
      s[i] = (b - a) / Math.max(a, b || 1e-9);
    }
    return s.reduce((u,v)=>u+v,0)/s.length;
  }

  // ====== RENDER ======
  function draw(){
    const seed   = seedS.value|0;
    const trueK  = trueKS.value|0;
    const nPer   = nPerS.value|0;
    const spread = spreadS.value;
    const k      = kS.value|0;

    const pts = genData(trueK, nPer, spread, seed, resampleNonce);
    const out = kmeans(pts, k, 50, seed, resampleNonce);
    const labeled = out.labeled;
    const centers = out.centers;

    // main scatter: base width (~80% of row) × 1.5
    plotDiv.innerHTML = "";
    const baseW = Math.max(360, Math.floor(((viz.clientWidth || box.clientWidth) * 0.8) - 16));
    const figW  = Math.floor(baseW * 1.5);
    const fig = Plot.plot({
      width: figW,
      height: 680,
      marginLeft: 56,
      marginBottom: 44,
      grid: true,
      x: {domain:[0,1], label:"x₁"},
      y: {domain:[0,1], label:"x₂"},
      marks: [
        Plot.dot(labeled, {
          x:"x", y:"y",
          fill:d=>palette(k)[d.cid],
          r:6, opacity:0.9, stroke:"white",
          title:d=>`cluster ${d.cid}`
        }),
        Plot.dot(centers, {x:"x", y:"y", r:10, symbol:"cross", stroke:"#000", strokeWidth:2, fill:"white"}),
        Plot.text(centers.map((c,i)=>({x:c.x,y:c.y,t:`C${i}`})), {x:"x", y:"y", text:"t", dy:-12, fill:"#000", fontWeight:700})
      ]
    });
    plotDiv.append(fig);

    // Silhouette table
    dash.innerHTML = "";
    const rows = [];
    let best = {k:2, s:-Infinity};
    for (let kk=2; kk<=10; kk++){
      const outkk = kmeans(pts, kk, 50, seed, resampleNonce);
      const s = silhouette(pts, outkk.labeled.map(d=>d.cid), kk);
      rows.push({k: kk, s});
      if (s > best.s) best = {k: kk, s};
    }

    const tbl = html`
      <table style="border-collapse:collapse;font:13px system-ui;min-width:180px;max-width:100%;width:100%;table-layout:fixed;">
        <colgroup>
          <col style="width:70px;">
          <col style="width:80px;"> <!-- Silhouette column ~60% narrower -->
        </colgroup>
        <thead>
          <tr>
            <th style="border:1px solid #ddd;padding:6px 8px;background:#f7f7f7;text-align:center;">k</th>
            <th style="border:1px solid #ddd;padding:6px 8px;background:#f7f7f7;text-align:center;">Silhouette</th>
          </tr>
        </thead>
        <tbody>
          ${rows.map(r=>{
            const isBest = (r.k===best.k);
            const bg = isBest ? "#e6ffe6" : "white";
            const fw = isBest ? "700" : "400";
            return html`<tr>
              <td style="border:1px solid #ddd;padding:6px 8px;text-align:center;background:${bg};font-weight:${fw}">${r.k}</td>
              <td style="border:1px solid #ddd;padding:6px 8px;text-align:right;background:${bg};font-weight:${fw}">${r.s.toFixed(4)}</td>
            </tr>`;
          })}
        </tbody>
      </table>`;
    dash.append(tbl);

    note.innerHTML = `True clusters (data): <b>${trueK}</b> · Displayed k (K-means): <b>${k}</b> · Best k by Silhouette: <b>${best.k}</b> ` +
                     (resampleNonce ? `<span style="color:#0a7">• resampled ×${resampleNonce}</span>` : "");
  }

  // events
  [seedS,trueKS,nPerS,spreadS,kS].forEach(el => el.addEventListener("input", draw));
  btnRes.addEventListener("click", () => { resampleNonce++; draw(); }); // ← เปลี่ยนชุดข้อมูลทุกครั้ง
  window.addEventListener("resize", draw);

  // initial
  draw();
  return box;
})()
Interactive Silhouette Values
(async () => {
  // ====== UI skeleton ======
  const box = html`<div style="max-width:980px;font:14px system-ui;">
    <div id="ctrl" style="display:flex; gap:12px; flex-wrap:wrap; margin-bottom:10px;"></div>
    <div id="plots" style="display:grid; grid-template-columns: 1fr 1fr; gap:14px;"></div>
    <div id="note" style="margin-top:6px;color:#444"></div>
  </div>`;
  const ctrl  = box.querySelector("#ctrl");
  const plots = box.querySelector("#plots");
  const note  = box.querySelector("#note");

  // ====== Controls ======
  const seedS   = Inputs.number({label:"Seed", value: 42, step:1, min:0});
  const nPerS   = Inputs.range([10, 80], {label:"Points per cluster", value: 30, step: 5});
  const spreadS = Inputs.range([0.2, 2.0], {label:"Spread (σ)", value: 0.7, step: 0.1});
  const kS      = Inputs.range([2, 4], {label:"K-means: k", value: 3, step: 1});
  const btnRes  = Inputs.button("Resample");
  ctrl.append(seedS, nPerS, spreadS, kS, btnRes);


  // ====== Utils ======
  function mulberry32(a){ return function(){ let t=a+=0x6D2B79F5; t=Math.imul(t^t>>>15,t|1); t^=t+Math.imul(t^t>>>7,t|61); return ((t^t>>>14)>>>0)/4294967296 } }
  function rnorm(rng, m=0, s=1){ let u=0,v=0; while(u===0) u=rng(); while(v===0) v=rng(); return m + s*Math.sqrt(-2*Math.log(u))*Math.cos(2*Math.PI*v); }
  const clamp = (x,a,b)=> Math.max(a, Math.min(b,x));
  const dist  = (a,b)=> Math.hypot(a.x-b.x, a.y-b.y);
  const dist2 = (a,b)=> { const dx=a.x-b.x, dy=a.y-b.y; return dx*dx+dy*dy; };
  const palette = k => ["#1f77b4","#ff7f0e","#2ca02c","#d62728"].slice(0,k);

  // ====== Data (true = 3 clusters) ======
  function genData(nPer, spread, seed){
    const rng = mulberry32(9000 + seed);
    const centers = [
      {x:0.25, y:0.30},
      {x:0.70, y:0.35},
      {x:0.50, y:0.75}
    ];
    const pts = [];
    for (let c=0;c<3;c++){
      for (let n=0;n<nPer;n++){
        pts.push({
          x: clamp(rnorm(rng, centers[c].x, spread*0.10), 0, 1),
          y: clamp(rnorm(rng, centers[c].y, spread*0.10), 0, 1)
        });
      }
    }
    return pts;
  }

  // ====== K-means (k-means++ init) ======
  function kmeansPPInit(points, k, rng){
    const n = points.length, centers = [];
    centers.push(points[(rng()*n)|0]);
    const d2 = new Array(n).fill(0);
    while(centers.length < k){
      for(let i=0;i<n;i++){
        let best=Infinity;
        for(const c of centers){ const vv = dist2(points[i], c); if(vv<best) best=vv; }
        d2[i] = best;
      }
      const sum = d2.reduce((s,x)=>s+x,0) || 1e-12;
      let r = rng()*sum, pick = 0;
      for(let i=0;i<n;i++){ r -= d2[i]; if(r<=0){ pick=i; break; } }
      centers.push({x:points[pick].x, y:points[pick].y});
    }
    return centers;
  }
  function kmeans(points, k, seed, maxIter=50){
    const rng = mulberry32(5000 + seed + k*31);
    k = Math.max(1, Math.min(k, points.length));
    let centers = kmeansPPInit(points, k, rng).map(c => ({x:c.x, y:c.y}));
    let labels  = new Array(points.length).fill(0);

    for(let it=0; it<maxIter; it++){
      let changed=false;
      for(let i=0;i<points.length;i++){
        let best=-1, bd=Infinity;
        for(let c=0;c<k;c++){
          const d=dist2(points[i], centers[c]);
          if(d<bd){ bd=d; best=c; }
        }
        if(labels[i]!==best){ labels[i]=best; changed=true; }
      }
      const sum = Array.from({length:k}, ()=>({x:0,y:0,c:0}));
      for(let i=0;i<points.length;i++){ const L=labels[i]; sum[L].x+=points[i].x; sum[L].y+=points[i].y; sum[L].c++; }
      for(let c=0;c<k;c++){ if(sum[c].c>0){ centers[c].x=sum[c].x/sum[c].c; centers[c].y=sum[c].y/sum[c].c; } }
      if(!changed) break;
    }
    return {labels, centers};
  }

  // ====== Silhouette per-point ======
  function silhouetteSamples(points, labels, k){
    const n = points.length;
    const groups = Array.from({length:k}, ()=>[]);
    for (let i=0;i<n;i++) groups[labels[i]].push(i);

    const D = new Array(n);
    for (let i=0;i<n;i++){
      D[i] = new Array(n);
      for (let j=0;j<n;j++){
        D[i][j] = (i===j? 0 : dist(points[i], points[j]));
      }
    }

    const s = new Array(n).fill(0);
    for (let i=0;i<n;i++){
      const ci = labels[i];
      const same = groups[ci];
      let a = 0;
      if (same.length>1){
        for (const j of same) if (j!==i) a += D[i][j];
        a /= (same.length-1);
      } else a = 0;

      let b = Infinity;
      for (let c=0;c<k;c++){
        if (c===ci || groups[c].length===0) continue;
        let avg=0;
        for (const j of groups[c]) avg += D[i][j];
        avg /= groups[c].length;
        if (avg<b) b=avg;
      }
      if (!isFinite(b)) b = a;
      s[i] = (b - a) / Math.max(a, b, 1e-12);
    }
    return s;
  }

  // ====== STATE (selection linking) ======
  let selected = new Set(); // indices

  function draw(){
    const seed   = seedS.value|0;
    const nPer   = nPerS.value|0;
    const spread = spreadS.value;
    const k      = kS.value|0;

    // data & kmeans
    const pts = genData(nPer, spread, seed);
    const {labels, centers} = kmeans(pts, k, seed);

    const cols = palette(k);
    const labeledPts = pts.map((p,i)=> ({...p, cid: labels[i], idx:i}));

    // silhouette per point → sort by cluster then by value desc
    const sil = silhouetteSamples(pts, labels, k);
    const silByCluster = sil
      .map((v,i)=> ({idx:i, s:v, cid: labels[i]}))
      .sort((a,b)=> (a.cid - b.cid) || (b.s - a.s));

    // cluster separators for barplot
    const clusterBreaks = [];
    for (let i=1; i<silByCluster.length; i++){
      if (silByCluster[i].cid !== silByCluster[i-1].cid) clusterBreaks.push(i - 0.5);
    }

    // ---------- Figures ----------
    function scatterFigure(){
      const base = labeledPts.filter(p => !selected.has(p.idx));
      const hi   = labeledPts.filter(p => selected.has(p.idx));
      return Plot.plot({
        width: 470, height: 430, marginLeft: 50, marginBottom: 40, grid:true,
        x: {domain:[0,1], label:"x₁"}, y:{domain:[0,1], label:"x₂"},
        marks: [
          Plot.dot(base, {x:"x", y:"y", r:3.6, fill:d=>cols[d.cid], stroke:"white", opacity:0.55, title:d=>`cluster ${d.cid}`}),
          Plot.dot(hi,   {x:"x", y:"y", r:6.0, fill:d=>cols[d.cid], stroke:"black", strokeWidth:1.5, title:d=>`SELECTED • i=${d.idx} • c=${d.cid}`}),
          Plot.dot(centers, {x:"x", y:"y", r:10, symbol:"cross", stroke:"#000", strokeWidth:2, fill:"white"}),
          Plot.text(centers.map((c,i)=>({x:c.x,y:c.y,t:`C${i}`})), {x:"x", y:"y", text:"t", dy:-12, fill:"#000", fontWeight:700})
        ]
      });
    }

    function barFigure(){
      const rows = silByCluster.map((d,i)=> ({rank:i, ...d}));
      return Plot.plot({
        width: 470, height: 430, marginLeft: 50, marginBottom: 40, grid:true,
        x: {label:"sorted by cluster → value (high → low)"},
        y: {label:"silhouette (−1..1)", domain:[-1,1]},
        marks: [
          Plot.ruleY([0]),
          clusterBreaks.length ? Plot.ruleX(clusterBreaks, {stroke:"#999", strokeOpacity:0.6, strokeDasharray:"4,3"}) : null,
          Plot.barY(rows, {
            x: "rank",
            y: "s",
            fill: d => selected.has(d.idx) ? "#222" : cols[d.cid],
            title: d => `i=${d.idx}, s=${d.s.toFixed(2)}, c=${d.cid}`
          })
        ]
      });
    }

    // render
    plots.innerHTML = "";
    let scatter = scatterFigure();
    let bars    = barFigure();
    plots.append(scatter);
    plots.append(bars);

    // click → toggle selection
    function bindBarClicks(barsNode){
      const rects = barsNode.querySelectorAll("rect");
      rects.forEach((rect, i) => {
        const d = silByCluster[i];
        rect.style.cursor = "pointer";
        rect.addEventListener("click", () => {
          if (selected.has(d.idx)) selected.delete(d.idx); else selected.add(d.idx);
          const s2 = scatterFigure();
          const b2 = barFigure();
          plots.replaceChild(s2, scatter);
          plots.replaceChild(b2, bars);
          scatter = s2; bars = b2;
          bindBarClicks(b2); // re-bind
          updateNote();
        }, {passive:true});
      });
    }
    bindBarClicks(bars);

    function updateNote(){
      const neg = sil.filter(v => v < 0).length;
      const near0 = sil.filter(v => Math.abs(v) < 0.05).length;
      const meanS = (sil.reduce((a,b)=>a+b,0)/sil.length).toFixed(3);
      note.innerHTML = `k = <b>${k}</b> · mean silhouette = <b>${meanS}</b> · negatives = <b>${neg}</b> · |s|<0.05 = <b>${near0}</b> · selected = <b>${selected.size}</b>`;
    }
    updateNote();
  }

  // events
  [seedS, nPerS, spreadS, kS].forEach(el => el.addEventListener("input", () => { selected.clear(); draw(); }));
  btnRes.addEventListener("click", () => { selected.clear(); draw(); });

  draw();
  return box;
})()
ข้อดีและข้อจำกัดของ -means
ข้อดีของ -means
✅ เข้าใจง่ายและนำไปใช้ได้จริง มีประสิทธิภาพในการคำนวณสูง ✅ ทำงานได้ดีเมื่อข้อมูลมีโครงสร้างของกลุ่มที่ชัดเจน ✅ สามารถประมวลผลข้อมูลขนาดใหญ่ได้อย่างมีประสิทธิภาพ
ข้อจำกัดของ -means
❌ ต้องกำหนดจำนวนคลัสเตอร์ ล่วงหน้า ❌ มีความไวต่อค่าผิดปกติ (outliers) ❌ ทำงานได้ไม่ดีเมื่อคลัสเตอร์มีรูปร่างไม่เป็นทรงกลม (non-spherical) หรือมีขนาดแตกต่างกันมาก
-means with Orange Data Mining
Example of -means in Orange (1)
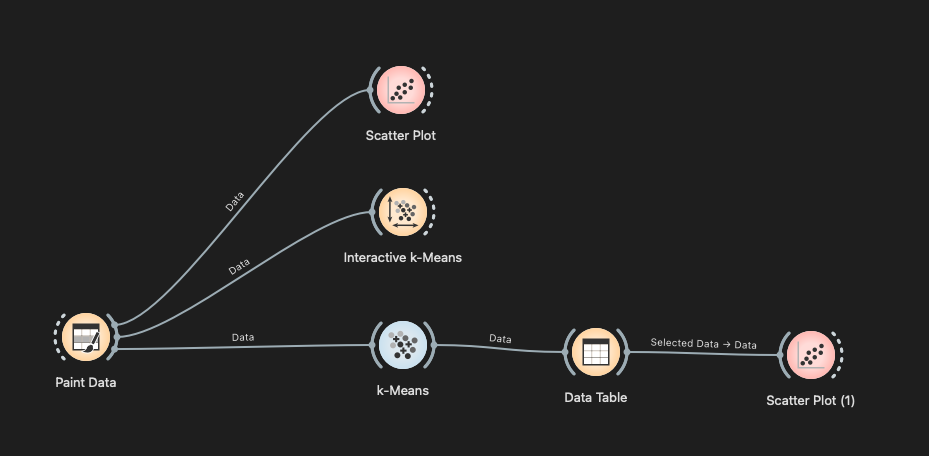
Example of -means in Orange (2)
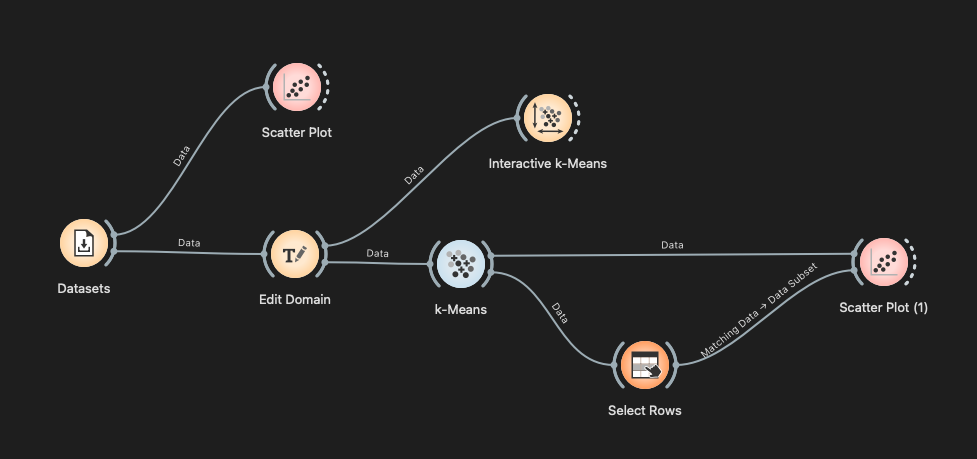
เมื่อใช้ Normalize ใน Orange Data Mining
⚠️ ระวังการตีความค่า Centroid
หากเลือก Normalize columns ใน K-means ของOrange Data Mining ค่า Centroid ที่ได้จะอยู่ใน หน่วยที่ผ่านการ Standardization แล้ว ดังนั้น ไม่ควรนำค่า Centroid ที่ได้ไปตีความในหน่วยเดิมโดยตรง
การ Standardization
เมื่อ
- = ค่าข้อมูลในหน่วยเดิม
- = ค่าเฉลี่ยของตัวแปรเดิม
- = ส่วนเบี่ยงเบนมาตรฐานของตัวแปรเดิม
- = ค่าหลัง Standardization
การแปลง Centroid กลับเป็นหน่วยเดิม
หากได้ค่า Centroid ในรูป Standardized Value เป็น
ตัวอย่าง
สมมติว่า Income
และค่า Centroid ที่ Orange แสดงคือ
ดังนั้น
จึงตีความได้ว่า
Centroid ของ Income = 450 (พันบาทต่อปี)
Remember: Normalize เพื่อช่วยให้ตัวแปรที่มีสเกลต่างกันสามารถใช้ในการจัดกลุ่มได้อย่างเหมาะสม
แต่เมื่อต้องการ ตีความ Cluster Profile ควรแปลง Centroid กลับไปยังหน่วยเดิมก่อน
Interpreting Clusters
หลังจากทำ Clustering แล้ว เราจะได้ Cluster Label เช่น
Cluster 1, Cluster 2, Cluster 3
แต่คำถามสำคัญคือ…
แต่ละ Cluster มีลักษณะอย่างไร และมีความหมายอะไรในโลกจริง?
Example: Customer Segmentation
บริษัทมีข้อมูลลูกค้า 12 คน จาก 3 Features
- Age: อายุ
- Annual Income: รายได้ต่อปี (พันบาท)
- Spending Score: คะแนนการใช้จ่าย (0–100)
หลังจากใช้ -means โดยกำหนด ได้ผลดังนี้
| Customer | Age | Income | Spending | Cluster |
|---|---|---|---|---|
| C01 | 22 | 300 | 82 | 3 |
| C02 | 25 | 360 | 88 | 3 |
| C03 | 28 | 420 | 76 | 3 |
| C04 | 31 | 450 | 81 | 3 |
| C05 | 42 | 850 | 35 | 1 |
| C06 | 45 | 920 | 28 | 1 |
| C07 | 50 | 1,000 | 32 | 1 |
| C08 | 48 | 950 | 40 | 1 |
| C09 | 35 | 900 | 78 | 2 |
| C10 | 38 | 1,050 | 85 | 2 |
| C11 | 40 | 1,100 | 90 | 2 |
| C12 | 36 | 980 | 82 | 2 |
Activity: What Do the Clusters Mean?
Cluster Profile
| Cluster | Avg. Age | Avg. Income | Avg. Spending |
|---|---|---|---|
| 3 | 26.5 | 382.5 | 81.8 |
| 1 | 46.3 | 930.0 | 33.8 |
| 2 | 37.3 | 1,007.5 | 83.8 |
👥 Group Activity
จากข้อมูลทางซ้าย ให้แต่ละกลุ่มอภิปราย
- ลูกค้า Cluster 1 มีลักษณะอย่างไร?
- ลูกค้า Cluster 2 มีลักษณะอย่างไร?
- ลูกค้า Cluster 3 มีลักษณะอย่างไร?
- ลองตั้ง ชื่อให้แต่ละ Cluster
- บริษัทควรทำการตลาดกับแต่ละกลุ่มอย่างไร?
From Clusters to Insights
🟦 Cluster 3
Young Active Spenders
- อายุค่อนข้างน้อย
- รายได้ยังไม่สูง
- Spending Score สูง
Possible Action
โปรโมชั่นสำหรับวัยเริ่มทำงาน
ส่วนลด / Loyalty Program
🟨 Cluster 1
High-Income Conservative
- อายุสูงกว่า Cluster อื่น
- รายได้สูง
- Spending Score ต่ำ
Possible Action
ค้นหาสาเหตุที่ใช้จ่ายต่ำ
เสนอสินค้า Premium ที่ตรงความต้องการ
🟩 Cluster 2
High-Value Customers
- อายุระดับกลาง
- รายได้สูงมาก
- Spending Score สูง
Possible Action
VIP Program
Personalized Offers
Customer Retention
Key Idea
Clustering does not automatically create knowledge.
หมายเลข Cluster เช่น 1, 2, 3 ไม่มีความหมายในตัวเอง
นักวิเคราะห์ต้องศึกษาคุณลักษณะของแต่ละกลุ่มแล้วจึงตีความและตั้งชื่อให้เหมาะสม
Orange Example

References
Hastie, T., Tibshirani, R., & Friedman, J. (2009). The elements of statistical learning: Data mining, inference, and prediction (2nd ed.). Springer. https://doi.org/10.1007/978-0-387-84858-7
James, G., Witten, D., Hastie, T., & Tibshirani, R. (2021). An introduction to statistical learning with applications in R (2nd ed.). Springer. https://doi.org/10.1007/978-1-0716-1418-1
Jain, A. K. (2010). Data clustering: 50 years beyond K-means. Pattern Recognition Letters, 31(8), 651–666. https://doi.org/10.1016/j.patrec.2009.09.011
Scikit-learn. (n.d.). K-means clustering. Retrieved from https://scikit-learn.org/stable/modules/clustering.html#k-means
Bishop, C. M. (2006). Pattern recognition and machine learning. Springer.