\(~~~~~~\)Why you need to learn R\(~~~~~~\)
Somsak Chanaim
International College of Digital Innovation, Chiang Mai University
October 29, 2025
Tools


\(~\)
\[~\] posit: Cheatsheet
Why R is good?
R is the most popular language in the world of Data Analytics/Science.
It helps analyze data that is both structured and unstructured.
It was made R the standard language for performing statistical operations.
R allows various features that differentiate it from other Data Analytics/Science languages.
R is a very good program for data visualization.
The most popular R packages

Why R is essential for Data Science?
R plays a vital role in Data Science, you will be benefited with following operations in R.
We can run a code without any compiler: R is an interpreted language, so that we can run code without any compiler.
Many calculations are done with vectors: R is a vector language, so anyone can add functions to a single Vector without putting it in a loop.
Statistical language: R is used in economics, business, finance, and statistics etc..
Why is R Good for Business?
R will also be a great help in business.
The primary reason is that R is open-source. Therefore it can be modified and redistributed as per the user’s need.
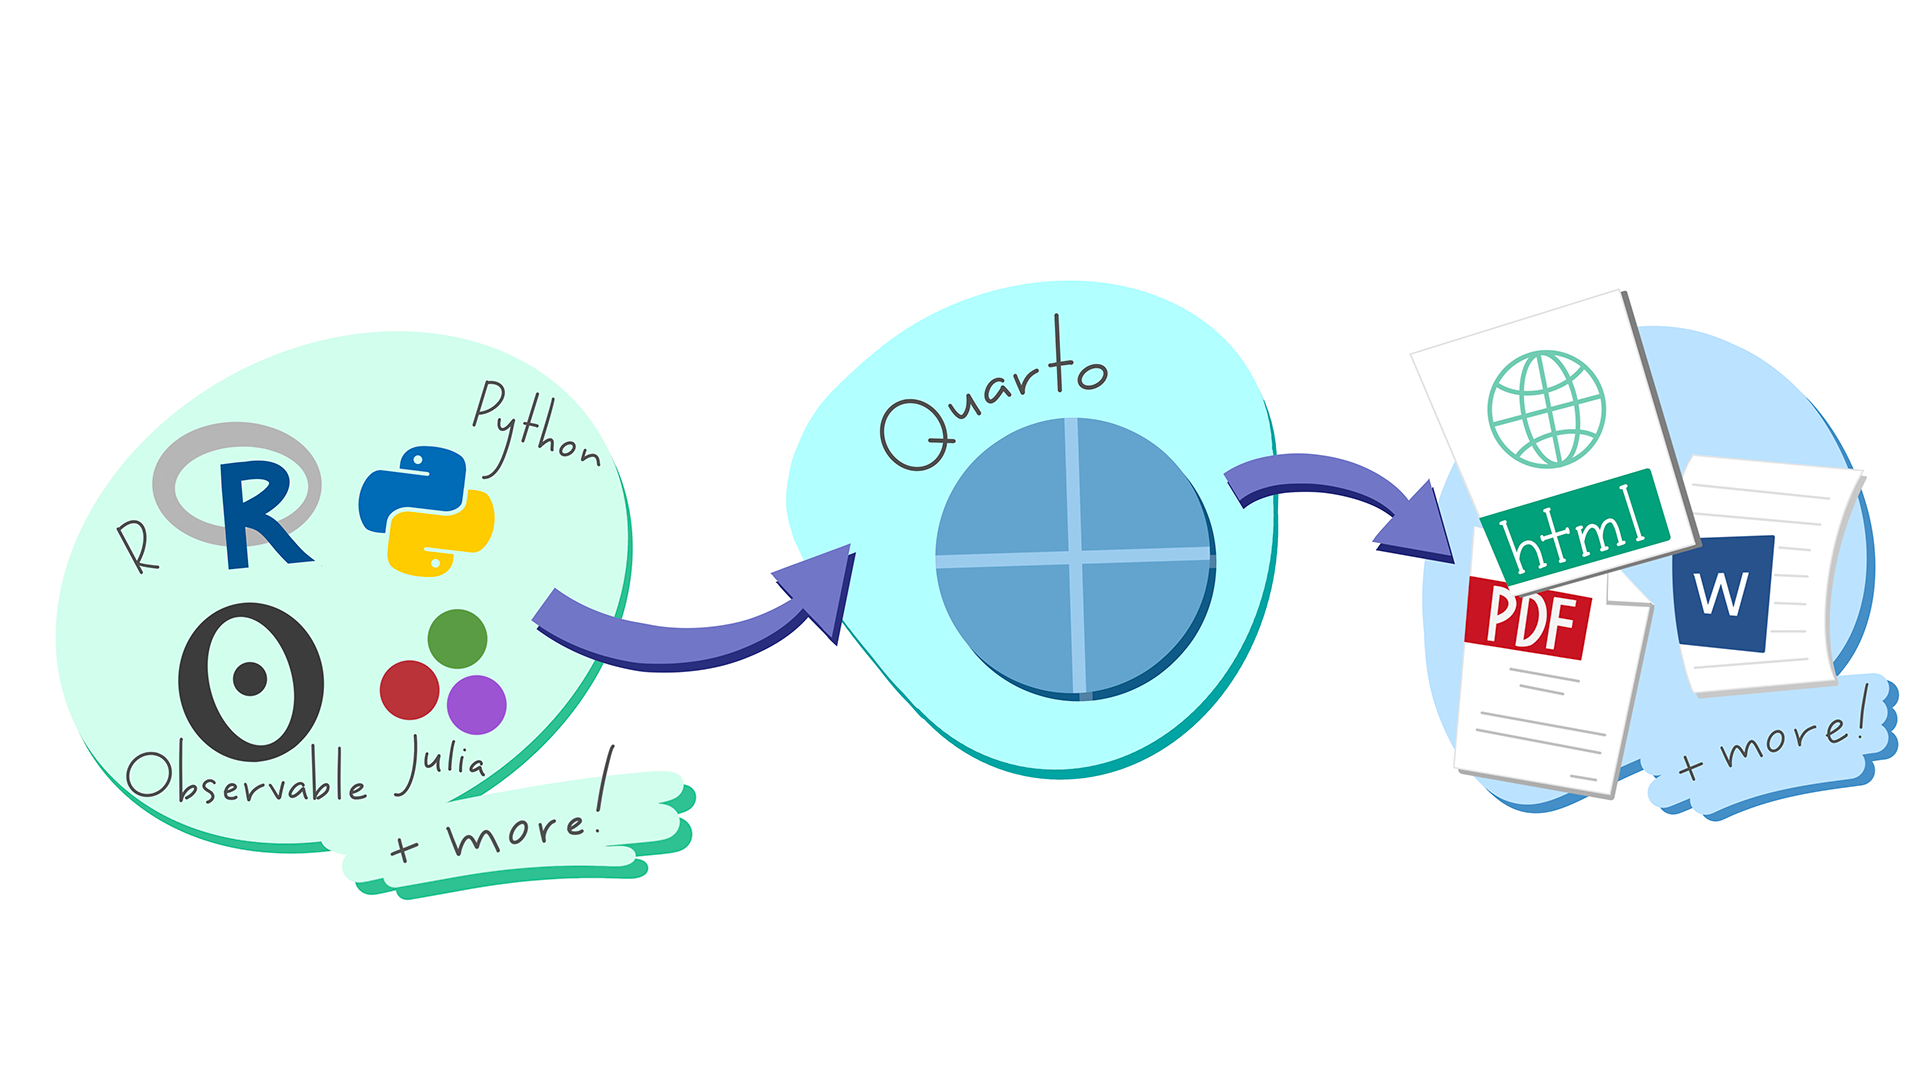
R has a tool to create a dynamic report (rmarkdown and quarto).
Open-source
R is an open-source language, you can modify various functions in R and make your packages. Since R is issued under the General Public Licence (GNU), there are no restrictions on its usage.
Popularity
R is one of the most popular programming languages in the industry. With the emergence of data science, the need for R in the industries became evident.

Robust Visualization Library
R comprises libraries like the ggplot2, plotly, and highcharter that offer graphical aesthetic plots to its users.

Quantmod
The quantmod package in R is a widely used package for quantitative financial modeling and trading analysis.
Web-Apps
R provides the package with the ability to build aesthetic web applications. For example, using the R Shiny package, we can develop interactive dashboards straight from the console of R IDE(recommend RStudio).
Interactive Histogram
viewof N = Inputs.range([1000, 10000], {step: 100, label: "N"})
viewof myColor = Inputs.color({ label: "Choose a color", value: "#ff0000" })
viewof myText = Inputs.text({ label: "Enter text", placeholder: "Type title" })

viewof Choices = Inputs.radio([
  "✔️ Yes",
  "❌ No"
], { label: "เลือกตัวเลือก:", value:
  "❌ No" })


viewof clicks = Inputs.button("Click to Random")
Interactive Dashboard
viewof x_var = Inputs.select(["gdpPercap", "lifeExp", "pop"], {label: "X-axis", value: "gdpPercap"})

viewof y_var = Inputs.select(["gdpPercap", "lifeExp", "pop"], {label: "Y-axis", value: "lifeExp"})

viewof continent_filter = Inputs.checkbox(
  ["Africa", "Americas", "Asia", "Europe", "Oceania"],
  { label: "Continents", value: ["Africa", "Americas", "Asia", "Europe", "Oceania"] }
)

viewof year_slider = Inputs.range([1952, 2007], {label: "Year", step: 5, value: 2007})

viewof legend_positions = Inputs.radio(["right", "left","top","bottom","none"], {label: "Legend", value: "right"})

viewof selected_theme = Inputs.select(
  ["theme_gray",
   "theme_bw",
   "theme_linedraw",
   "theme_light",
   "theme_minimal",
   "theme_classic",
   "theme_void",
   "theme_dark",
   "theme_excel",
   "theme_fivethirtyeight",
   "theme_gdocs",
   "theme_hc",
   "theme_pander",
   "theme_solarized",
   "theme_tufte",
   "theme_wsj"],
  { label: "Theme", value: "theme_gray" } // ค่าเริ่มต้นเป็น theme_gray
)
Data manipualate with dplyr
viewof filter_species = Inputs.checkbox(["setosa", "versicolor", "virginica"], { label: "Filter by Species", value: ["setosa", "versicolor", "virginica"] })

// เลือกตัวแปรที่ต้องการ select
viewof select_vars = Inputs.checkbox(["Sepal.Length", "Sepal.Width", "Petal.Length", "Petal.Width", "Species"], { label: "Select Variables", value: ["Sepal.Length", "Sepal.Width", "Petal.Length", "Petal.Width", "Species"] })

// เพิ่มตัวแปรใหม่ด้วย mutate
viewof mutate_option = Inputs.radio(["Sepal.Area", "Petal.Area", "None"], { label: "Mutate New Variable", value: "None" })

// เลือกตัวแปรสำหรับ arrange
viewof arrange_var = Inputs.select(["Sepal.Length", "Sepal.Width", "Petal.Length", "Petal.Width", "Species"], { label: "Arrange by", value: "Sepal.Length" })

// กำหนดทิศทาง arrange
viewof arrange_desc = Inputs.toggle({ label: "Descending Order?" })
Advantages of R Programming
There are several benefits and some limitations of the R programming language.
Pros of R Language
R is the most comprehensive statistical analysis package, as new technology and ideas often appear first in R.
R is open-source. We can run R anywhere at any time and even sell it under the conditions of the license.
It is cross-platform and runs on many operating systems. It is best for GNU/Linux, Windows, and MAC OS.
Everyone is welcome to provide bug fixes, code enhancements, and new packages.
Disadvantages of R Programming
Cons of R Language
The quality of some packages in R is less than perfect.
There is no customer support for R language if something does not work.
R commands are hardly concerned with memory management.
The Learning Curve of R Programming

https://www.linkedin.com/pulse/things-try-when-your-r-code-fails-angela-cao
Install R
Download R
Install RStudio
\(~\)Download RStudio

Install quarto
Download quarto
Test the R program on these slides
03:00