International College of Digital Innovation, CMU
August 10, 2026
We cannot use the
quantmodpackage to download data from Yahoo Finance in WebR.
Yahoo Finance has restricted public API access, and WebR does not allow direct internet connections.
Therefore, we use synthetic OHLC data generated within R to demonstrate
xtsand time-series operations.
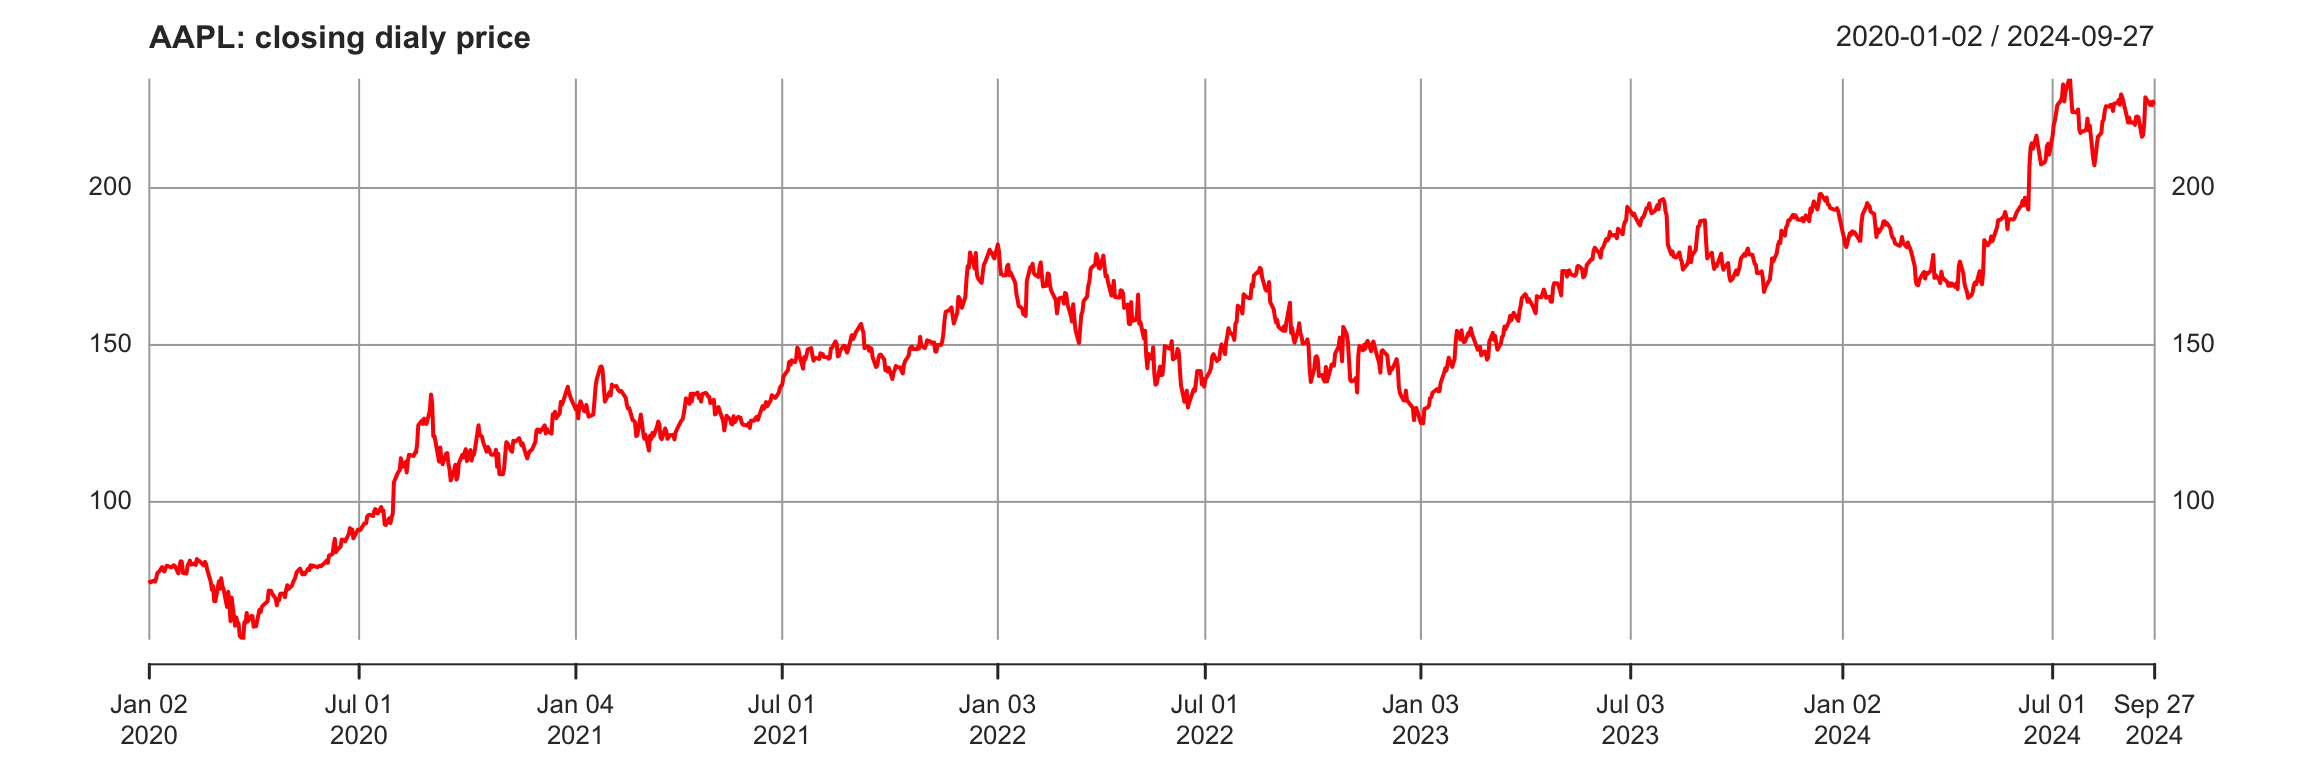
Download daily price of AAPL from Yahoo finance, from \(~~\)1 Jan 2020 to 30 Sep 2024, and upload to Rstudio and make this plot
The quantmod is useful for quantitative financial modelling framework and have three goals:
download data
charting
technical indicator
getSymbols() function
getSymbols: The function for load and manage data from multiple source
Recommend the arguments
Symbols : vector of stock or asset name
src : “yahoo”, FRED” , etc (this course use yahoo)
periodicity : “daily”, “weekly”, or monthly”
from : Starting day: Year-month-day (2020-11-31)
to : Ending day: Year-month-day (2022-12-31)
The object from yahoo finance is XTS.
o show that we cannot download data from Yahoo Finance using WebR.
[1] "AAPL"or download multiple stocks price
eXtensible Time Series (xts)
eXtensible Time Series (xts) is a powerful package that provides an extensible time series class, enabling uniform handling of many R time series classes by extending zoo.
The main benefit of using xts is the compatibility with other packages that use different time-series classes (timeSeries, zoo, …).
We have 3 xts objects, AAPL, META, and MSFT
           AAPL.Open AAPL.High AAPL.Low AAPL.Close AAPL.Volume AAPL.Adjusted
2020-01-02   74.0600   75.1500  73.7975    75.0875   135480400      72.87610
2020-01-03   74.2875   75.1450  74.1250    74.3575   146322800      72.16759
2020-01-06   73.4475   74.9900  73.1875    74.9500   118387200      72.74265
2020-01-07   74.9600   75.2250  74.3700    74.5975   108872000      72.40054
2020-01-08   74.2900   76.1100  74.2900    75.7975   132079200      73.56520
2020-01-09   76.8100   77.6075  76.5500    77.4075   170108400      75.12778
Warning
In this study, We don’t need the variables AAPL.Volume and AAPL.Adjusted
           AAPL.Open AAPL.High AAPL.Low AAPL.Close
2020-01-02   74.0600   75.1500  73.7975    75.0875
2020-01-03   74.2875   75.1450  74.1250    74.3575
2020-01-06   73.4475   74.9900  73.1875    74.9500
2020-01-07   74.9600   75.2250  74.3700    74.5975
2020-01-08   74.2900   76.1100  74.2900    75.7975
2020-01-09 76.8100 77.6075 76.5500 77.4075 AAPL.Open AAPL.High AAPL.Low AAPL.Close
2023-01-03 130.28 130.90 124.17 125.07
2023-01-04 126.89 128.66 125.08 126.36
2023-01-05 127.13 127.77 124.76 125.02
2023-01-06 126.01 130.29 124.89 129.62
2023-01-09 130.47 133.41 129.89 130.15
2023-01-10 130.26 131.26 128.12 130.73
2023-01-11 131.25 133.51 130.46 133.49
2023-01-12 133.88 134.26 131.44 133.41
2023-01-13 132.03 134.92 131.66 134.76
2023-01-17 134.83 137.29 134.13 135.94
...
2023-12-15 197.53 198.40 197.00 197.57
2023-12-18 196.09 196.63 194.39 195.89
2023-12-19 196.16 196.95 195.89 196.94
2023-12-20 196.90 197.68 194.83 194.83
2023-12-21 196.10 197.08 193.50 194.68
2023-12-22 195.18 195.41 192.97 193.60
2023-12-26 193.61 193.89 192.83 193.05
2023-12-27 192.49 193.50 191.09 193.15
2023-12-28 194.14 194.66 193.17 193.58
2023-12-29 193.90 194.40 191.73 192.53 AAPL.Open AAPL.High AAPL.Low AAPL.Close
2022-12-01 148.21 149.13 146.61 148.31
2022-12-02 145.96 148.00 145.65 147.81
2022-12-05 147.77 150.92 145.77 146.63
2022-12-06 147.07 147.30 141.92 142.91
2022-12-07 142.19 143.37 140.00 140.94
2022-12-08 142.36 143.52 141.10 142.65
2022-12-09 142.34 145.57 140.90 142.16
2022-12-12 142.70 144.50 141.06 144.49
2022-12-13 149.50 149.97 144.24 145.47
2022-12-14 145.35 146.66 141.16 143.21
2022-12-15 141.11 141.80 136.03 136.50
2022-12-16 136.69 137.65 133.73 134.51
2022-12-19 135.11 135.20 131.32 132.37
2022-12-20 131.39 133.25 129.89 132.30
2022-12-21 132.98 136.81 132.75 135.45
2022-12-22 134.35 134.56 130.30 132.23
2022-12-23 130.92 132.42 129.64 131.86
2022-12-27 131.38 131.41 128.72 130.03
2022-12-28 129.67 131.03 125.87 126.04
2022-12-29 127.99 130.48 127.73 129.61
2022-12-30 128.41 129.95 127.43 129.93
2023-01-03 130.28 130.90 124.17 125.07
2023-01-04 126.89 128.66 125.08 126.36
2023-01-05 127.13 127.77 124.76 125.02
2023-01-06 126.01 130.29 124.89 129.62
2023-01-09 130.47 133.41 129.89 130.15
2023-01-10 130.26 131.26 128.12 130.73
2023-01-11 131.25 133.51 130.46 133.49
2023-01-12 133.88 134.26 131.44 133.41
2023-01-13 132.03 134.92 131.66 134.76
2023-01-17 134.83 137.29 134.13 135.94
2023-01-18 136.82 138.61 135.03 135.21
2023-01-19 134.08 136.25 133.77 135.27
2023-01-20 135.28 138.02 134.22 137.87
2023-01-23 138.12 143.32 137.90 141.11
2023-01-24 140.31 143.16 140.30 142.53
2023-01-25 140.89 142.43 138.81 141.86
2023-01-26 143.17 144.25 141.90 143.96
2023-01-27 143.16 147.23 143.08 145.93
2023-01-30 144.96 145.55 142.85 143.00
2023-01-31 142.70 144.34 142.28 144.29 AAPL.Open AAPL.High AAPL.Low AAPL.Close
2020-01-02 74.0600 75.1500 73.7975 75.0875
2020-01-03 74.2875 75.1450 74.1250 74.3575
2020-01-06 73.4475 74.9900 73.1875 74.9500
2020-01-07 74.9600 75.2250 74.3700 74.5975
2020-01-08 74.2900 76.1100 74.2900 75.7975
2020-01-09 76.8100 77.6075 76.5500 77.4075
2020-01-10 77.6500 78.1675 77.0625 77.5825
2020-01-13 77.9100 79.2675 77.7875 79.2400
2020-01-14 79.1750 79.3925 78.0425 78.1700
2020-01-15 77.9625 78.8750 77.3875 77.8350
...
2022-05-20 139.0900 140.7000 132.6100 137.5900
2022-05-23 137.7900 143.2600 137.6500 143.1100
2022-05-24 140.8100 141.9700 137.3300 140.3600
2022-05-25 138.4300 141.7900 138.3400 140.5200
2022-05-26 137.3900 144.3400 137.1400 143.7800
2022-05-27 145.3900 149.6800 145.2600 149.6400
2022-05-31 149.0700 150.6600 146.8400 148.8400
2022-06-01 149.9000 151.7400 147.6800 148.7100
2022-06-02 147.8300 151.2700 146.8600 151.2100
2022-06-03 146.9000 147.9700 144.4600 145.3800 AAPL.Open AAPL.High AAPL.Low AAPL.Close
2023-02-01 143.97 146.61 141.32 145.43
2023-02-02 148.90 151.18 148.17 150.82
2023-02-03 148.03 157.38 147.83 154.50
2023-02-06 152.57 153.10 150.78 151.73
2023-02-07 150.64 155.23 150.64 154.65
2023-02-08 153.88 154.58 151.17 151.92
2023-02-09 153.78 154.33 150.42 150.87
2023-02-10 149.46 151.34 149.22 151.01
2023-02-13 150.95 154.26 150.92 153.85
2023-02-14 152.12 153.77 150.86 153.20
...
2024-09-16 216.54 217.22 213.92 216.32
2024-09-17 215.75 216.90 214.50 216.79
2024-09-18 217.55 222.71 217.54 220.69
2024-09-19 224.99 229.82 224.63 228.87
2024-09-20 229.97 233.09 227.62 228.20
2024-09-23 227.34 229.45 225.81 226.47
2024-09-24 228.65 229.35 225.73 227.37
2024-09-25 224.93 227.29 224.02 226.37
2024-09-26 227.30 228.50 225.41 227.52
2024-09-27 228.46 229.52 227.30 227.79 AAPL.Open AAPL.High AAPL.Low AAPL.Close
2020-01-02 74.0600 75.150 73.7975 75.0875
2020-01-03 74.2875 75.145 74.1250 74.3575 AAPL.Open AAPL.High AAPL.Low AAPL.Close
2020-01-02 74.0600 75.1500 73.7975 75.0875
2020-01-03 74.2875 75.1450 74.1250 74.3575
2020-01-06 73.4475 74.9900 73.1875 74.9500
2020-01-07 74.9600 75.2250 74.3700 74.5975
2020-01-08 74.2900 76.1100 74.2900 75.7975
2020-01-09 76.8100 77.6075 76.5500 77.4075
2020-01-10 77.6500 78.1675 77.0625 77.5825
2020-01-13 77.9100 79.2675 77.7875 79.2400
2020-01-14 79.1750 79.3925 78.0425 78.1700
2020-01-15 77.9625 78.8750 77.3875 77.8350
2020-01-16 78.3975 78.9250 78.0225 78.8100
2020-01-17 79.0675 79.6850 78.7500 79.6825 AAPL.Open AAPL.High AAPL.Low AAPL.Close
2020-01-02 74.06 75.15 73.7975 75.0875 AAPL.Open AAPL.High AAPL.Low AAPL.Close
2024-09-23 227.34 229.45 225.81 226.47
2024-09-24 228.65 229.35 225.73 227.37
2024-09-25 224.93 227.29 224.02 226.37
2024-09-26 227.30 228.50 225.41 227.52
2024-09-27 228.46 229.52 227.30 227.79 AAPL.Open AAPL.High AAPL.Low AAPL.Close
2024-09-16 216.54 217.22 213.92 216.32
2024-09-17 215.75 216.90 214.50 216.79
2024-09-18 217.55 222.71 217.54 220.69
2024-09-19 224.99 229.82 224.63 228.87
2024-09-20 229.97 233.09 227.62 228.20
2024-09-23 227.34 229.45 225.81 226.47
2024-09-24 228.65 229.35 225.73 227.37
2024-09-25 224.93 227.29 224.02 226.37
2024-09-26 227.30 228.50 225.41 227.52
2024-09-27 228.46 229.52 227.30 227.79 AAPL.Open AAPL.High AAPL.Low AAPL.Close
2024-09-27 228.46 229.52 227.3 227.79 AAPL.Open AAPL.High AAPL.Low AAPL.Close
2020-01-03 74.0600 75.1500 73.7975 74.3575
2020-01-10 73.4475 78.1675 73.1875 77.5825
2020-01-17 77.9100 79.6850 77.3875 79.6825
2020-01-24 79.2975 80.8325 78.9125 79.5775
2020-01-31 77.5150 81.9625 76.2200 77.3775
2020-02-07 76.0750 81.3050 75.5550 80.0075
2020-02-14 78.5450 81.8050 78.4625 81.2375
2020-02-21 78.8400 81.1625 77.6250 78.2625
2020-02-28 74.3150 76.0450 64.0925 68.3400
2020-03-06 70.5700 76.0000 69.4300 72.2575
...
2024-07-26 227.0100 227.7800 214.6200 217.9600
2024-08-02 216.9600 225.6000 215.7500 219.8600
2024-08-09 199.0900 216.7800 196.0000 216.2400
2024-08-16 216.0700 226.8300 215.6000 226.0500
2024-08-23 225.7200 228.3400 223.0400 226.8400
2024-08-30 226.7600 232.9200 223.8900 229.0000
2024-09-06 228.5500 229.0000 217.4800 220.8200
2024-09-13 220.8200 224.0400 216.7100 222.5000
2024-09-20 216.5400 233.0900 213.9200 228.2000
2024-09-27 227.3400 229.5200 224.0200 227.7900 AAPL.Open AAPL.High AAPL.Low AAPL.Close
Jan 2020 74.0600 81.9625 73.1875 77.3775
Feb 2020 76.0750 81.8050 64.0925 68.3400
Mar 2020 70.5700 76.0000 53.1525 63.5725
Apr 2020 61.6250 73.6325 59.2250 73.4500
May 2020 71.5625 81.0600 71.4625 79.4850
Jun 2020 79.4375 93.0950 79.3025 91.2000
Jul 2020 91.2800 106.4150 89.1450 106.2600
Aug 2020 108.2000 131.0000 107.8925 129.0400
Sep 2020 132.7600 137.9800 103.1000 115.8100
Oct 2020 117.6400 125.3900 107.7200 108.8600
Nov 2020 109.1100 121.9900 107.3200 119.0500
Dec 2020 121.0100 138.7900 120.0100 132.6900
Jan 2021 133.5200 145.0900 126.3800 131.9600
Feb 2021 133.7500 137.8800 118.3900 121.2600
Mar 2021 123.7500 128.7200 116.2100 122.1500
Apr 2021 123.6600 137.0700 122.4900 131.4600
May 2021 132.0400 134.0700 122.2500 124.6100
Jun 2021 125.0800 137.4100 123.1300 136.9600
Jul 2021 136.6000 150.0000 135.7600 145.8600
Aug 2021 146.3600 153.4900 144.5000 151.8300
Sep 2021 152.8300 157.2600 141.2700 141.5000
Oct 2021 141.9000 153.1700 138.2700 149.8000
Nov 2021 148.9900 165.7000 147.4800 165.3000
Dec 2021 167.4800 182.1300 157.8000 177.5700
Jan 2022 177.8300 182.9400 154.7000 174.7800
Feb 2022 174.0100 176.6500 152.0000 165.1200
Mar 2022 164.7000 179.6100 150.1000 174.6100
Apr 2022 174.0300 178.4900 155.3800 157.6500
May 2022 156.7100 166.4800 132.6100 148.8400
Jun 2022 149.9000 151.7400 129.0400 136.7200
Jul 2022 136.0400 163.6300 135.6600 162.5100
Aug 2022 161.0100 176.1500 157.1400 157.2200
Sep 2022 156.6400 164.2600 138.0000 138.2000
Oct 2022 138.2100 157.5000 134.3700 153.3400
Nov 2022 155.0800 155.4500 134.3800 148.0300
Dec 2022 148.2100 150.9200 125.8700 129.9300
Jan 2023 130.2800 147.2300 124.1700 144.2900
Feb 2023 143.9700 157.3800 141.3200 147.4100
Mar 2023 146.8300 165.0000 143.9000 164.9000
Apr 2023 164.2700 169.8500 159.7800 169.6800
May 2023 169.2800 179.3500 164.3100 177.2500
Jun 2023 177.7000 194.4800 176.9300 193.9700
Jul 2023 193.7800 198.2300 186.6000 196.4500
Aug 2023 196.2400 196.7300 171.9600 187.8700
Sep 2023 189.4900 189.9800 167.6200 171.2100
Oct 2023 171.2200 182.3400 165.6700 170.7700
Nov 2023 171.0000 192.9300 170.1200 189.9500
Dec 2023 190.3300 199.6200 187.4500 192.5300
Jan 2024 187.1500 196.3800 180.1700 184.4000
Feb 2024 183.9900 191.0500 179.2500 180.7500
Mar 2024 179.5500 180.5300 168.4900 171.4800
Apr 2024 171.1900 178.3600 164.0800 170.3300
May 2024 169.5800 193.0000 169.1100 192.2500
Jun 2024 192.9000 220.2000 192.1500 210.6200
Jul 2024 212.0900 237.2300 211.9200 222.0800
Aug 2024 224.3700 232.9200 196.0000 229.0000
Sep 2024 228.5500 233.0900 213.9200 227.7900 AAPL.Open AAPL.High AAPL.Low AAPL.Close
2020 Q1 74.060 81.9625 53.1525 63.5725
2020 Q2 61.625 93.0950 59.2250 91.2000
2020 Q3 91.280 137.9800 89.1450 115.8100
2020 Q4 117.640 138.7900 107.3200 132.6900
2021 Q1 133.520 145.0900 116.2100 122.1500
2021 Q2 123.660 137.4100 122.2500 136.9600
2021 Q3 136.600 157.2600 135.7600 141.5000
2021 Q4 141.900 182.1300 138.2700 177.5700
2022 Q1 177.830 182.9400 150.1000 174.6100
2022 Q2 174.030 178.4900 129.0400 136.7200
2022 Q3 136.040 176.1500 135.6600 138.2000
2022 Q4 138.210 157.5000 125.8700 129.9300
2023 Q1 130.280 165.0000 124.1700 164.9000
2023 Q2 164.270 194.4800 159.7800 193.9700
2023 Q3 193.780 198.2300 167.6200 171.2100
2023 Q4 171.220 199.6200 165.6700 192.5300
2024 Q1 187.150 196.3800 168.4900 171.4800
2024 Q2 171.190 220.2000 164.0800 210.6200
2024 Q3 212.090 237.2300 196.0000 227.7900Case 1: Export only one xts object to an .xlsx file.
Step 1: Convert the xts object to a data frame.
coredata() extracts the data values from the xts object, excluding the time index.
as.data.frame() converts the extracted data into a standard data frame.
DF_AAPL$Date <- index(AAPL) adds a new column called Date, containing the time index from the original xts object.
Step 2: Save data frame DF_AAP to xlsx
Case 2: Export multiple xts objects to an .xlsx file.
Step 1: Convert the xts object to a data frame.
Step 2: Save every data frame to xlsx
You can download financial time series data from my webapp.
Assume we have excel file file.xlsx
tibble [968 × 7] (S3: tbl_df/tbl/data.frame)
 $ date           : POSIXct[1:968], format: "2021-01-04" "2021-01-05" ...
 $ PTT.BK.Open    : num [1:968] 41 42.2 43 43 42.8 ...
 $ PTT.BK.High    : num [1:968] 42.8 42.5 43.5 43.2 43.5 ...
 $ PTT.BK.Low     : num [1:968] 40.8 41.2 42.5 42.2 42 ...
 $ PTT.BK.Close   : num [1:968] 42.5 42 42.8 42.5 42.8 ...
 $ PTT.BK.Volume  : num [1:968] 74638600 75867500 88565400 63128900 83698400 ...
 $ PTT.BK.Adjusted: num [1:968] 33 32.6 33.1 33 33.1 ...
Convert the data frame TS to an XTS object using this function.
           PTT.BK.Open PTT.BK.High PTT.BK.Low PTT.BK.Close PTT.BK.Volume
2021-01-04       41.00       42.75      40.75        42.50      74638600
2021-01-05       42.25       42.50      41.25        42.00      75867500
2021-01-06       43.00       43.50      42.50        42.75      88565400
2021-01-07       43.00       43.25      42.25        42.50      63128900
2021-01-08       42.75       43.50      42.00        42.75      83698400
2021-01-11       42.75       43.00      42.50        43.00      45553200
2021-01-12 43.00 44.00 42.50 43.75 101081900Extract and display the stock data for “MSFT” for the year 2021. Use the xts package’s subsetting techniques to filter by date.
Subset the “META” data to include only the observations between January 1, 2022, and December 31, 2022.
Extract the data for “MSFT” for the first quarter of 2023 (January to March) and display the results.
Create a subset of “META” data for the first 10 weeks of 2024 and calculate the average closing price during that period.
Extract “MSFT” data for the first 6 months of 2021 and 2023, and compare the average closing prices for these two periods.
Subset the “META” data to get the last 8 weeks of observations before September 30, 2024.