Pre-test: Logistic Regression with Orange Data Mining
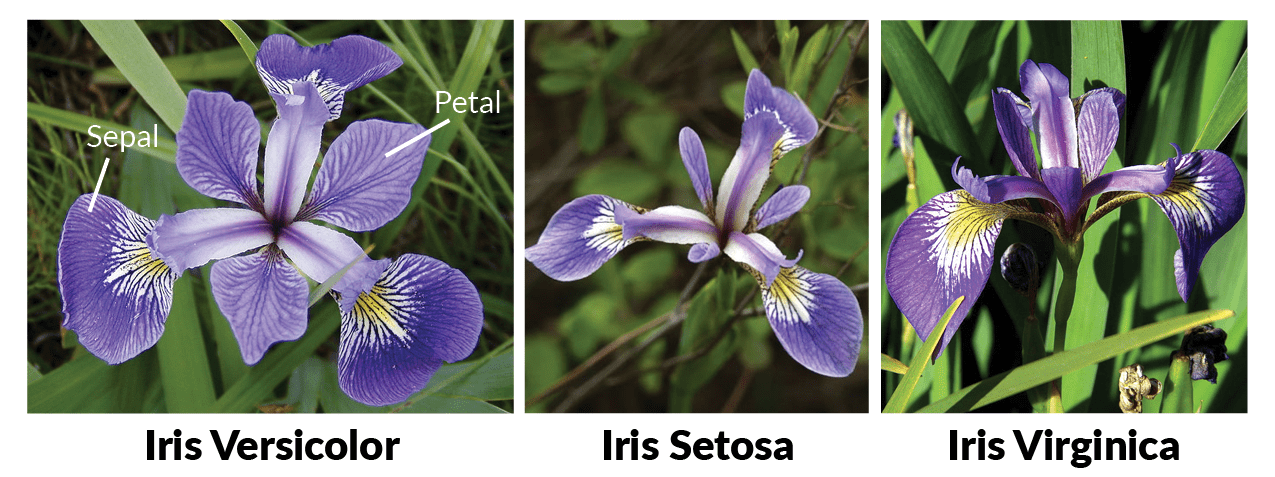
The Iris dataset is a classic dataset in the field of machine learning and statistics. It contains measurements of 150 iris flowers from three different species: Iris setosa, Iris versicolor, and Iris virginica. For each flower, the dataset provides four features (attributes):
Sepal length (in centimeters)
Sepal width (in centimeters)
Petal length (in centimeters)
Petal width (in centimeters)
In addition to these features, the dataset includes the species of the iris flower (the target variable).
The Iris dataset is commonly used for classification tasks, where the goal is to predict the species of a flower based on its measurements.
For logistic regression applied to the Iris dataset, where we aim to classify the species based on the four features (sepal length, sepal width, petal length, petal width), the general form of the equation can be written as follows:
For each species \(k \in \{\text{setosa}, \text{versicolor}, \text{virginica}\}\), the probability of a sample belonging to class \(k\) is modeled by:
[ P(y = k ) = ]
Where: - \(\mathbf{x} = [x_1, x_2, x_3, x_4]\) are the features (sepal length, sepal width, petal length, petal width), - \(\beta_{k0}\) is the intercept for class \(k\), - \(\beta_{k1}, \beta_{k2}, \beta_{k3}, \beta_{k4}\) are the coefficients for the features for class \(k\), - \(P(y = k \mid \mathbf{x})\) is the probability that a sample belongs to class \(k\), - The denominator sums over all three classes to normalize the probabilities.
For each species:
Setosa \((k=1)\): \[ P(y = \text{setosa} \mid \mathbf{x}) = \frac{e^{\beta_{10} + \beta_{11} x_1 + \beta_{12} x_2 + \beta_{13} x_3 + \beta_{14} x_4}}{\sum_{j=1}^{3} e^{\beta_{j0} + \beta_{j1} x_1 + \beta_{j2} x_2 + \beta_{j3} x_3 + \beta_{j4} x_4}} \]
Versicolor \((k=2)\): \[ P(y = \text{versicolor} \mid \mathbf{x}) = \frac{e^{\beta_{20} + \beta_{21} x_1 + \beta_{22} x_2 + \beta_{23} x_3 + \beta_{24} x_4}}{\sum_{j=1}^{3} e^{\beta_{j0} + \beta_{j1} x_1 + \beta_{j2} x_2 + \beta_{j3} x_3 + \beta_{j4} x_4}} \]
Virginica \((k=3)\): \[ P(y = \text{virginica} \mid \mathbf{x}) = \frac{e^{\beta_{30} + \beta_{31} x_1 + \beta_{32} x_2 + \beta_{33} x_3 + \beta_{34} x_4}}{\sum_{j=1}^{3} e^{\beta_{j0} + \beta_{j1} x_1 + \beta_{j2} x_2 + \beta_{j3} x_3 + \beta_{j4} x_4}} \]
This is the logistic regression model for multiclass classification applied to the Iris dataset using the softmax function. Each class gets its own set of coefficients \(\beta\), and the probabilities are normalized so that the sum of probabilities across all three classes equals 1.
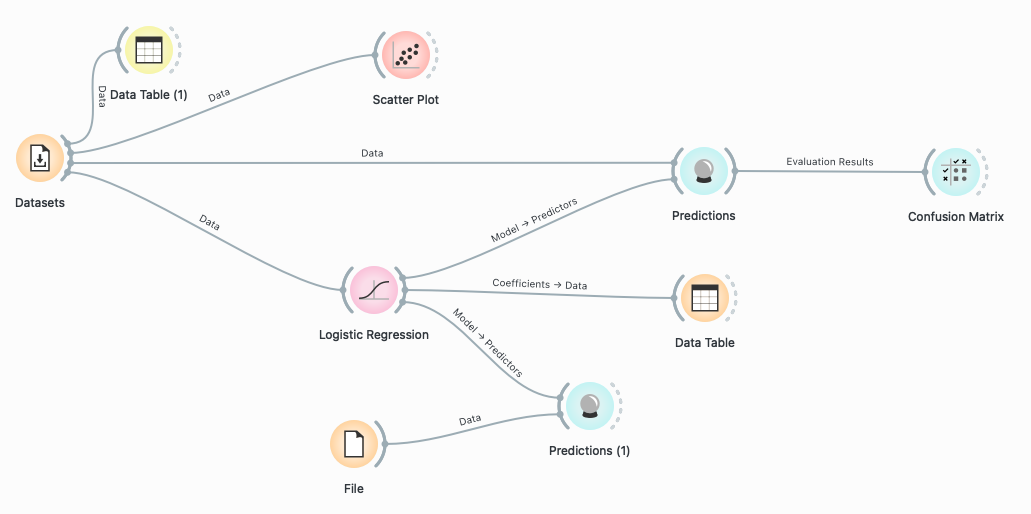
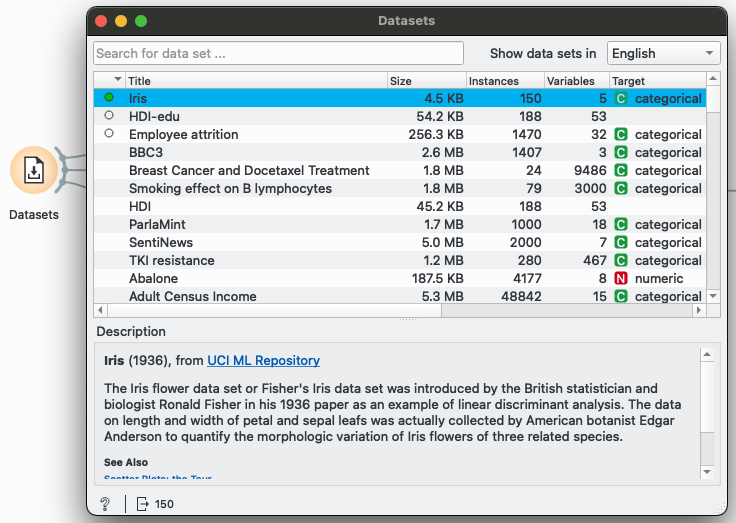
Datasets widget
Open the Prediction widget
What is the value of CA (Classification Accuracy)?
Open the confusion matrix widget
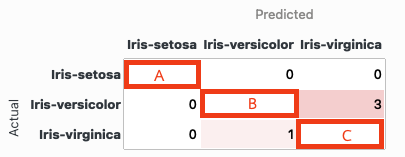
What are the value of
A = , B = , C =
click here to download excel file for prediction data
What is the predict value from logistic regression?
| iris | sepal length | sepal width | petal length | petal width |
|---|---|---|---|---|
| 5.3 | 3.7 | 1.5 | 0.2 | |
| 6.2 | 3.4 | 5.4 | 2.3 | |
| 5.1 | 2.5 | 3.0 | 1.1 | |
| 5.9 | 3.0 | 5.1 | 1.8 | |
| 5.0 | 3.3 | 1.4 | 0.2 | |
| 5.7 | 2.8 | 4.1 | 1.3 |